


![Kong Interview Preparation Guide [2025]](https://www.devopstraininginstitute.com/blog/uploads/images/202509/image_430x256_68dbb95326997.jpg)


Why Is Observability Critical for Maintaining SLIs and SLOs?
In today's complex, distributed systems, traditional monitoring is no longer sufficient. This guide explains why observability is critical for maintaining Service Level Indicators (SLIs) and Service Level Objectives (SLOs), which are foundational to a reliable service. We explore how the three pillars of observability—metrics, logs, and traces—provide the deep, holistic insights needed to understand system behavior. Learn how to connect the symptoms of a problem to its root cause, proactively manage your service's error budget, and transform your team from a reactive firefighting force into proactive architects of reliability. This is a key part of a successful business that is looking to scale its operations and is a major part of the modern workflow that is focused on providing a high level of service availability.
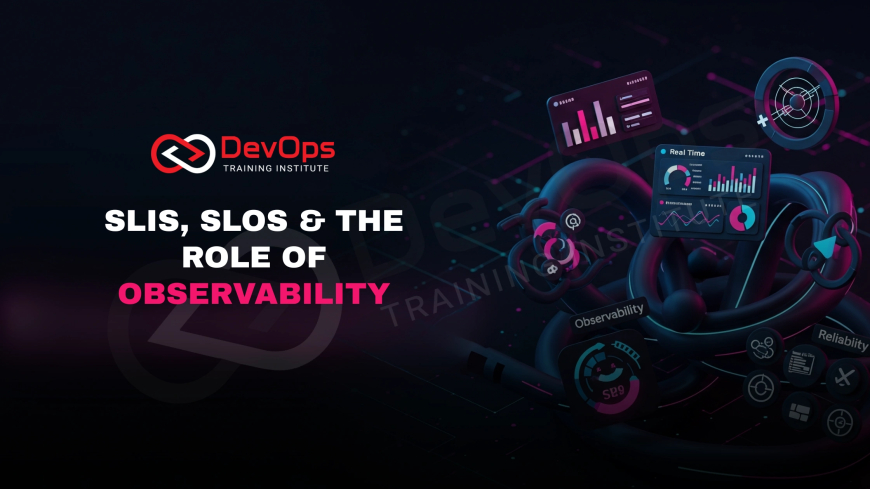
In the complex, distributed world of modern cloud-native applications, a single request can traverse dozens of microservices, each running on its own container in a Kubernetes cluster. In this environment, the traditional approach to monitoring—checking a predefined set of metrics like CPU and memory usage—is no longer sufficient to guarantee the reliability of a service. As a result, organizations have moved towards a more customer-centric view of system health, focusing on what truly matters: a service's ability to meet its performance and availability commitments. This is where the concepts of Service Level Indicators (SLIs) and Service Level Objectives (SLOs) come into play. An SLI is a quantifiable metric of service performance, such as latency or availability, while an SLO is a specific, numerical goal for that metric, such as 99.9% availability. However, defining these targets is only half the battle. Without a deep, holistic understanding of what is happening inside your system, a team is left guessing why an SLO has been violated. This is precisely why observability has become a critical practice. Observability is not just about knowing that a system is broken; it is about having the ability to understand why it is broken without deploying new code. It provides the necessary context and insights to connect the symptoms (a violated SLO) with the root cause, enabling engineers to maintain the reliability goals that are crucial for both business success and customer trust. Observability, therefore, serves as the fundamental engine for a data-driven approach to service reliability and is an essential tool for any organization that is looking to maintain a high level of service availability and performance.
Table of Contents
- What Are SLIs, SLOs, and Observability?
- How Does Observability Help Maintain SLOs?
- Why Is Observability More Than Just Monitoring?
- How Do the Three Pillars Support SLIs?
- A Tale of Two Approaches: Monitoring vs. Observability
- What Are the Tools for Implementing Observability?
- Real-World Examples of SLIs and SLOs
- Conclusion
- Frequently Asked Questions
What Are SLIs, SLOs, and Observability?
In the world of Site Reliability Engineering (SRE), three terms form the foundation of a data-driven approach to system health: Service Level Indicators (SLIs), Service Level Objectives (SLOs), and Service Level Agreements (SLAs). An SLI is a quantifiable metric that measures the level of service provided. It is a raw data point, such as the number of requests per second, the latency of a specific API call, or the percentage of successful requests. An SLO is a specific target or goal for an SLI. For instance, an SLI of "request success rate" might have an SLO of "99.9% of all requests must be successful." An SLO represents a commitment to the customer about a specific level of performance. An SLA is a formal, contractual agreement with a customer that includes financial penalties if the SLOs are not met. The true value of SLIs and SLOs lies in their ability to provide a customer-centric view of system performance. Instead of focusing on internal metrics like CPU utilization, they focus on what the user actually experiences, such as whether a page loads quickly or an API call returns a successful response. This shift in focus is a major step towards a more reliable and user-focused service.
Defining Observability
Observability is a property of a system that allows you to understand its internal state from its external outputs. Unlike traditional monitoring, which answers "what" is happening (e.g., "CPU is at 90%"), observability provides the context to answer "why" it is happening. Observability is powered by three key pillars: logs, metrics, and traces. Logs are timestamped records of events that occurred at a specific point in time, providing a narrative of what a system was doing. Metrics are numerical measurements collected over time, such as CPU utilization or request count, and are best for a high-level overview. Traces show the end-to-end journey of a single request across multiple services, providing a detailed view of how a distributed system interacts. Together, these three pillars provide the deep insight needed to understand the complex behavior of a modern system. Observability is not just about collecting data; it is about making that data actionable, which is essential for maintaining a high level of service availability.
How Does Observability Help Maintain SLOs?
Observability is the essential tool for maintaining SLOs because it provides the data and context needed to manage a service's "error budget." An error budget is the amount of acceptable unreliability an SLO allows. For example, a 99.9% availability SLO for a service with 100,000 requests per day has an error budget of 100 failed requests per day. When an error occurs and the error budget is consumed, it is an alert to the team that the SLO is at risk. However, without observability, a team is left with only the symptom: the SLO is being violated. Observability provides the ability to drill down and understand the root cause. For example, if the SLO for latency is at risk, metrics can show a spike in response time, traces can pinpoint which microservice is causing the delay, and logs can provide the specific error message that led to the slowdown. This comprehensive view allows the team to move from a reactive state of simply knowing there's a problem to a proactive state of understanding and fixing it, which is the key to maintaining a high level of service availability and is a core part of the value proposition of observability.
Connecting Symptoms to Root Causes
When an SLO is violated, it is often the result of a complex interplay between multiple components. Observability's three pillars work together to provide a holistic view. Metrics can show a general trend, like a spike in error rates. Traces can then be used to follow a single failed request from start to finish, revealing the exact path it took and the specific service that failed. Logs from that service can then provide a detailed narrative of what happened at the time of the failure. This seamless connection between high-level trends and low-level details allows engineers to efficiently identify the root cause of an issue, drastically reducing the time it takes to resolve a problem and get the service back within its SLO. Without this, a team would be left with little more than a cryptic error message and a lot of guesswork, which is a major time-consuming and costly part of a developer's workflow.
Proactive Management of the Error Budget
Observability isn't just for when things go wrong; it's also a powerful tool for proactive management. By continuously monitoring SLIs and tracking them against the error budget, a team can see when a service is trending towards an SLO violation. This provides an early warning, allowing the team to address the issue before it becomes a customer-facing problem. For example, if a metric shows that the success rate is slowly declining, an engineer can use traces and logs to investigate the cause before the SLO is violated. This proactive approach is a cornerstone of a mature SRE practice and is what distinguishes a reliable service from an unreliable one. Observability is the engine that drives this proactive management, providing the data and insights needed to keep a service healthy and reliable.
Why Is Observability More Than Just Monitoring?
The terms "monitoring" and "observability" are often used interchangeably, but they represent two fundamentally different approaches to understanding system health. Monitoring is about knowing the state of your system by asking predefined questions about a known set of metrics. For example, a monitoring system can tell you if a server's CPU is above 80% or if an API's latency is higher than 500ms. Monitoring is excellent for alerting you to a problem that you already know how to look for. It is based on a hypothesis: "if the CPU is high, there is a problem." However, in a complex, distributed system, it is impossible to anticipate every possible failure mode. An issue might arise from a completely unforeseen interaction between two services, a misconfigured load balancer, or a subtle bug that only appears under a specific traffic pattern. This is where monitoring falls short.
Moving from Known to Unknown Unknowns
Observability, on the other hand, is about asking questions you didn't know you needed to ask. It provides the ability to explore the data and discover the root cause of an issue that was completely unknown beforehand. By collecting a rich, detailed, and interconnected set of logs, metrics, and traces, an observability platform empowers engineers to debug novel issues without having to deploy new code. It provides a comprehensive picture of the system's internal state, allowing a team to identify the precise moment an issue began, the specific services it affected, and the exact cause of the failure. This ability to handle "unknown unknowns" is what makes observability so critical for modern, complex applications and is a key difference between the two approaches, which is a major part of the modern workflow.
How Do the Three Pillars Support SLIs?
The three pillars of observability—metrics, logs, and traces—work in harmony to provide the data required to measure and maintain SLIs. Metrics are the primary source for a high-level view of your SLIs. You can use metrics to calculate the success rate of a service (availability), the time it takes for a request to be completed (latency), or the percentage of resources being used. Metrics provide the numbers that allow you to determine if you are meeting your SLOs. They are the initial alert system, letting you know that a problem exists. However, they lack the granularity to tell you why a problem is occurring. This is where the other two pillars come in. Logs provide the detailed narrative of what happened at a specific point in time, and traces provide the detailed journey of a single request, which is essential for understanding the root cause of a problem and is a key part of the modern workflow. The combination of all three provides a holistic view of the system that is crucial for maintaining a high level of service availability and performance, which is a key part of a successful business. The pillars work together to provide a complete picture of the system and are a key part of the modern observability platform.
The Role of Logs in Debugging
Logs provide the detailed, timestamped records of events that occurred within your system. They can be used to capture specific error messages, user actions, or system events. When an SLO is violated, logs can provide the precise context needed to understand the cause. For example, if a request to a database fails, the logs from the database service can show the specific query that was run and the error it returned. This level of detail is essential for debugging complex issues and is a major part of the value proposition of a modern observability platform that is focused on providing a complete picture of the system's behavior.
The Importance of Traces for Distributed Systems
In a distributed system, a single request can travel across multiple services. A single metric or log can only provide a fragmented view of the request's journey. Traces provide an end-to-end view of a single request, showing the sequence of calls between different services and the time it took for each call to complete. If a latency SLO is violated, a trace can immediately pinpoint which service in the chain is causing the delay, which is an invaluable debugging tool for a modern microservices architecture and is a key part of a successful SRE team. Traces are essential for understanding the complete picture of a system's behavior.
A Tale of Two Approaches: Monitoring vs. Observability
To provide a clear overview of the differences, the following table compares the two approaches to system health across key criteria. This comparison highlights why a modern, centralized approach is the superior choice for any complex, distributed system. Understanding these differences is the first step toward making a data-driven decision about your team's approach to system health. The comparison is designed to quickly illustrate the inherent limitations of the old approach and the corresponding strengths of the new one, making the value proposition of a modern observability platform readily apparent. By evaluating these factors, an organization can easily determine if they have reached the point where a traditional approach is no longer a viable or safe option for their business and is a major part of the strategic conversation that is needed for any organization that is looking to scale its operations.
| Criteria | Monitoring (Reactive) | Observability (Proactive) |
|---|---|---|
| Focus | Answers "What is happening?" on a known set of metrics. | Answers "Why is it happening?" for unknown failures. |
| Approach | Hypothesis-based; relies on predefined alerts and dashboards. | Exploratory; allows for asking novel questions of the data. |
| Data Sources | Primarily metrics (e.g., CPU, RAM, network traffic). | Metrics, logs, and traces are deeply interconnected. |
| Problem Solving | Diagnosing a known problem with a known cause. | Debugging and understanding a new, unknown problem. |
| Key Benefit | Alerts you when a known threshold is exceeded. | Helps you find the root cause of an unexpected issue. |
| Time to Resolution | Can be slow for unknown issues, as it requires guesswork. | Rapid; provides the necessary context to quickly find the root cause. |
| Complexity | Lower; a good fit for simple, monolithic applications. | Higher; essential for complex, distributed microservices. |
What Are the Tools for Implementing Observability?
Implementing a robust observability practice requires a combination of tools for collecting, processing, and visualizing data. The modern observability ecosystem is vast and includes both open-source and commercial solutions. For metrics, popular open-source tools include **Prometheus**, which is a powerful time-series database and alerting system, and **Grafana**, which is a widely used data visualization and dashboarding platform. For logs, the ELK Stack (Elasticsearch, Logstash, and Kibana) is a common choice, providing a robust solution for log ingestion, storage, and analysis. For traces, **OpenTelemetry** is an open-source standard for collecting and sending traces, metrics, and logs. It provides a vendor-neutral API for instrumenting your applications, which allows you to switch between different backend observability platforms without having to rewrite your code. These tools are the building blocks of a modern observability platform and are a key part of the modern workflow. Many commercial vendors, such as Datadog, New Relic, and Dynatrace, offer all-in-one solutions that combine these pillars into a single platform, providing a seamless experience for engineers, which is a major part of the value proposition of these platforms. The choice of tools depends on your team's needs, budget, and expertise, but the combination of these three pillars is essential for a mature observability practice that is focused on providing a complete picture of the system's behavior and is a major part of the modern workflow.
The Role of OpenTelemetry
OpenTelemetry is a game-changer for observability. It provides a standardized way to instrument your applications, regardless of the language or framework you are using. This means you can collect traces, metrics, and logs from your application and send them to any backend that supports the OpenTelemetry standard. This vendor-neutral approach eliminates vendor lock-in and allows you to choose the best-of-breed tools for each of your observability needs. This is a major step forward for the industry and is a key part of a modern, open-source-first approach to observability.
Real-World Examples of SLIs and SLOs
To make the concepts of SLIs and SLOs more concrete, it's helpful to look at real-world examples from common services. For an e-commerce website, a key SLI could be the "checkout success rate." The corresponding SLO could be "the checkout success rate must be 99.9% over a 30-day period." Another example for a video streaming service could be the "video start-up time." An SLI could be the time it takes for a video to start playing after a user clicks "play." The corresponding SLO could be "99% of all videos must start within 2 seconds." For a financial service, an SLI could be "API request latency," with an SLO of "the 99th percentile latency must be less than 500ms." These examples show how SLIs and SLOs are directly tied to the user experience and business goals. Observability provides the data needed to calculate these SLIs in real-time, allowing teams to know exactly where they stand in relation to their SLOs, which is a major part of the modern workflow and is a key part of a successful business. Without this data, a team would be left with a lot of guesswork and a lack of clear direction, which is a major time-consuming and costly part of a developer's workflow and is a major part of a successful business that is looking to scale its operations.
The Importance of Defining an Error Budget
Once you have defined your SLIs and SLOs, the next step is to define an error budget. An error budget is a numerical representation of the amount of acceptable unreliability you have over a certain time period. For example, if your service has an availability SLO of 99.9% over 30 days, your error budget is 0.1% of the total requests in that period. Every time a request fails, you "spend" a part of your error budget. When the error budget is exhausted, it means you have failed to meet your SLO. This provides a clear, data-driven way to manage reliability and is a key part of the modern SRE practice that is focused on providing a high level of service availability and performance.
Conclusion
In the complex landscape of modern distributed systems, a traditional monitoring approach is no longer sufficient to guarantee the reliability of a service. The move towards a customer-centric view, defined by Service Level Indicators and Service Level Objectives, requires a more profound and holistic understanding of system health. This is precisely why observability is not just a trend but a critical, foundational practice for any organization committed to maintaining its reliability goals. Observability, through the seamless integration of metrics, logs, and traces, provides the necessary context to connect the symptoms of a problem with its root cause, empowering engineers to debug "unknown unknowns" and proactively manage their service's error budget. It transforms a team from being reactive firefighters into proactive architects of reliability, ensuring that service performance is a data-driven science rather than a matter of guesswork. Ultimately, observability is the engine that drives a successful SLO strategy, allowing organizations to maintain the trust of their customers and the integrity of their services by providing a complete and actionable view of their systems. This is a major part of a successful business that is looking to scale its operations and is a major part of the modern workflow that is focused on providing a high level of service availability.
Frequently Asked Questions
What is the difference between an SLI and an SLO?
An SLI (Service Level Indicator) is a raw, quantifiable metric that measures a service's performance, such as request latency. An SLO (Service Level Objective) is a specific target for that SLI, such as "99% of requests must have a latency of less than 200ms." The SLI is what you measure, and the SLO is your goal for that measurement.
Why is a distributed tracing system important for observability?
A distributed tracing system is important because it shows the end-to-end journey of a single request across multiple services in a distributed system. This is crucial for debugging performance issues or errors, as it can pinpoint exactly which service in the chain is causing a problem, which is a key part of a modern observability platform and a major part of the modern workflow.
What is the "error budget" and how does it relate to SLOs?
An error budget is the amount of acceptable unreliability an SLO allows over a given time period. For example, a 99.9% availability SLO has a 0.1% error budget. When the error budget is exhausted, it means you have failed to meet your SLO, providing a clear, data-driven way to manage reliability and risk.
What is the difference between monitoring and observability?
Monitoring tells you if a known issue is happening by asking predefined questions about your system (e.g., "Is the CPU high?"). Observability provides the context to understand why an issue is happening, even for a problem you've never seen before. It allows you to ask novel questions of your data, which is a major part of a modern observability platform.
What are some common examples of SLIs?
Common examples of SLIs include availability (the percentage of successful requests), latency (the time it takes for a request to be completed), and throughput (the number of requests per second). These metrics are directly tied to the user experience and are a key part of a successful business that is looking to provide a high level of service to its customers.
Why is observability critical for modern microservices architectures?
Observability is critical for modern microservices because a single transaction can span multiple, decoupled services. Without observability, it's nearly impossible to debug a problem or pinpoint the root cause of a failure. It provides the necessary context to understand the complex interactions between services, which is a major part of the modern workflow.
How do logs, metrics, and traces work together?
Logs, metrics, and traces work together to provide a holistic view. Metrics provide a high-level overview, logs provide a detailed narrative of events, and traces provide the end-to-end journey of a single request. They are three distinct but interconnected data types that are essential for a complete understanding of a system's behavior and are a key part of a modern observability platform.
Can you have an SLO without observability?
You can define an SLO without observability, but you can't effectively maintain it. Without the deep insights provided by observability, you will be left with no way to understand why an SLO is being violated. Observability provides the data and context needed to proactively manage and debug issues, which is a major part of the modern workflow.
What is the role of OpenTelemetry in observability?
OpenTelemetry is an open-source standard for collecting and sending logs, metrics, and traces. It provides a vendor-neutral way to instrument your applications, which allows you to switch between different backend observability platforms without having to rewrite your code. It's a major step towards an open-source-first approach to observability that is a key part of the modern workflow.
Why is a centralized observability platform better than separate tools?
A centralized observability platform, like those offered by commercial vendors, is better than a collection of separate tools because it provides a seamless, integrated view of all three pillars. This eliminates the need to switch between different dashboards and simplifies the debugging process, which is a major part of the modern workflow and is a key part of a successful business.
How does observability help with proactive maintenance?
Observability helps with proactive maintenance by providing real-time data on the health of your services. By continuously monitoring your SLIs, you can see when a service is trending towards an SLO violation. This provides an early warning, allowing you to address the issue before it becomes a customer-facing problem, which is a major part of the modern workflow.
How does observability help with capacity planning?
Observability helps with capacity planning by providing a clear view of your system's resource utilization. By monitoring metrics like CPU, memory, and network usage, you can predict when your service will need more resources. This allows you to scale your infrastructure proactively, ensuring that your service can handle increased traffic without violating your SLOs.
Can you use observability to improve your software delivery?
Yes, observability can be used to improve your software delivery. By monitoring the performance of new releases, you can identify a regression or a bug before it affects all users. This provides a feedback loop that allows you to make data-driven decisions about your software delivery process, which is a key part of the modern workflow and is a major part of a successful business.
How does observability help with security?
Observability can help with security by providing a detailed record of all events that occurred within your system. By collecting and analyzing logs and traces, you can detect a security breach or an unauthorized access attempt. This provides the necessary context to investigate a security incident and is a major part of a modern security practice.
What is the best way to get started with observability?
The best way to get started with observability is to start with a single application and define its SLIs and SLOs. Then, you can use a combination of tools to collect logs, metrics, and traces from that application. Once you have a working setup, you can then expand to other services, which is a major part of the modern workflow.
What is the cost of not having observability?
The cost of not having observability can be high. It can lead to longer resolution times, which can result in a loss of revenue and customer trust. It can also lead to a lack of understanding of your system's behavior, which can result in a lack of innovation and a lack of business agility, which is a major part of a successful business.
How does observability help with root cause analysis?
Observability helps with root cause analysis by providing the necessary context to connect the symptoms of a problem with its root cause. By correlating logs, metrics, and traces, you can identify the precise moment an issue began, the specific services it affected, and the exact cause of the failure, which is a major part of the modern workflow and a major part of a successful business.
What is a single pane of glass?
A single pane of glass is a centralized dashboard or platform that provides a unified view of all your system's data, including logs, metrics, and traces. It eliminates the need to switch between different tools and simplifies the debugging process, which is a major part of the modern workflow and is a key part of a successful business.
What is the role of a Service Level Agreement (SLA)?
A Service Level Agreement (SLA) is a formal, contractual agreement with a customer that includes financial penalties if the SLOs are not met. While an SLO is a goal for a team, an SLA is a commitment to a customer, which is a major part of a successful business that is looking to provide a high level of service to its customers.
How does observability benefit non-technical stakeholders?
Observability benefits non-technical stakeholders by providing a clear, data-driven view of service performance. By defining SLIs and SLOs, non-technical stakeholders can understand the business impact of a technical issue. This fosters a shared understanding of what matters and helps to align business goals with technical goals, which is a major part of the modern workflow.
What's Your Reaction?
 Like
0
Like
0
 Dislike
0
Dislike
0
 Love
0
Love
0
 Funny
0
Funny
0
 Angry
0
Angry
0
 Sad
0
Sad
0
 Wow
0
Wow
0


![100+ Azure DevOps Interview Questions and Answers [Updated 2025]](https://www.devopstraininginstitute.com/blog/uploads/images/202509/image_140x98_68c40aa9a3834.jpg)


![Future Scope of DevOps Careers in Pune [Updated 2025]](https://www.devopstraininginstitute.com/blog/uploads/images/202510/image_140x98_68e3a84652312.jpg)


