Build a world class engineering portfolio with these ten essential DevOps projec...
Unlock the full power of container orchestration in 2026 by mastering the top tw...
Ensure your software delivery remains flawless by implementing the twelve most p...
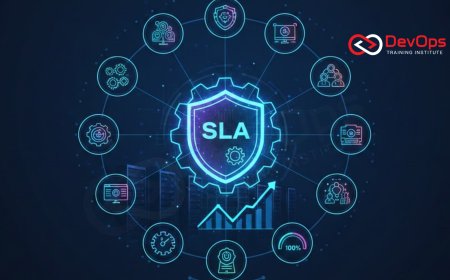
Ensure your engineering organization meets its service commitments with our deta...

Enhance your container orchestration strategy by exploring twelve essential Kube...
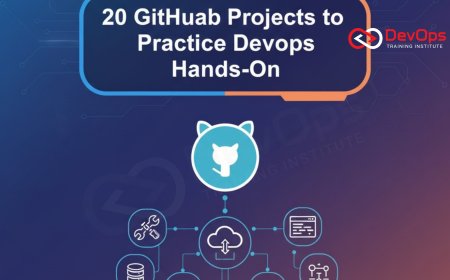
Discover twenty high demand GitHub projects to practice DevOps hands on and elev...
Unlock deep insights into your containerized infrastructure with our comprehensi...
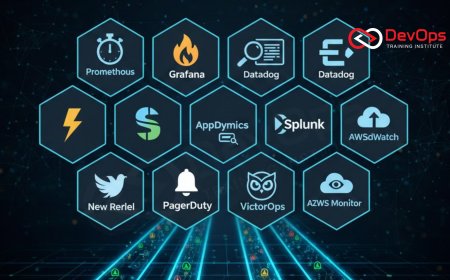
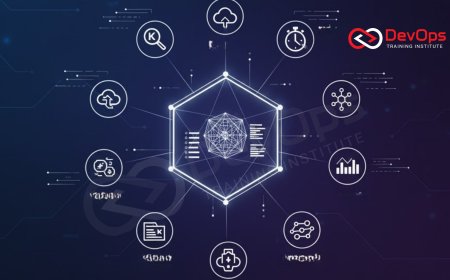
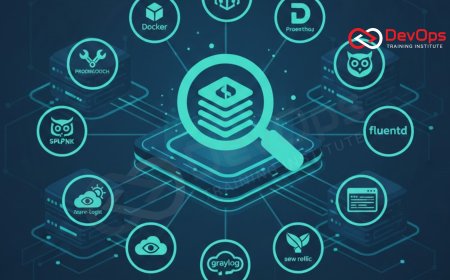
Discover the top eighteen observability tools that provide seamless support for ...

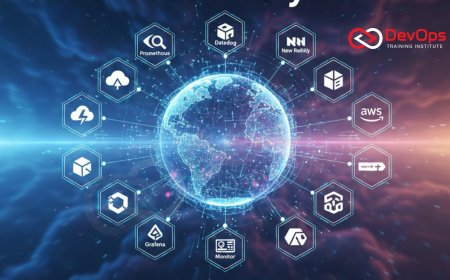
Discover the Top 20 DevOps Tools for Hybrid Cloud Environments in 2025 designed ...
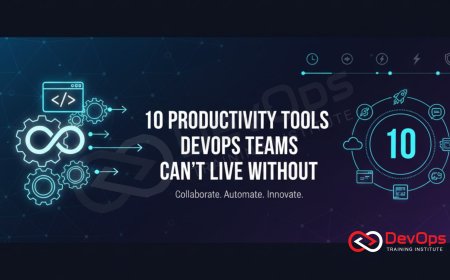
Discover the most essential productivity tools that modern engineering teams use...
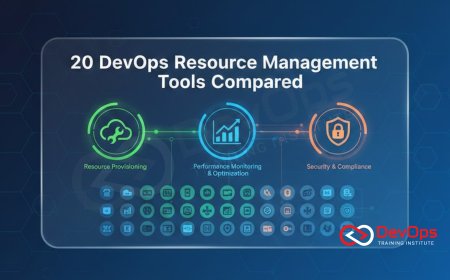
Discover a comprehensive comparison of twenty essential DevOps resource manageme...
Explore a definitive list of 20 powerful DevOps tools engineered for efficient l...
Discover the ten essential incident response tools necessary for maintaining ser...

Scaling DevOps in a large enterprise environment requires more than just automat...
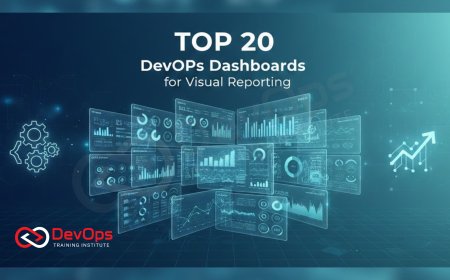
Dive deep into the top 20 DevOps dashboards and visual reporting tools that are ...
Discover the 10 essential API monitoring tools favored by DevOps Teams for maint...


![Kong Interview Preparation Guide [2025]](https://www.devopstraininginstitute.com/blog/uploads/images/202509/image_430x256_68dbb95326997.jpg)


![100+ Azure DevOps Interview Questions and Answers [Updated 2025]](https://www.devopstraininginstitute.com/blog/uploads/images/202509/image_140x98_68c40aa9a3834.jpg)


![Future Scope of DevOps Careers in Pune [Updated 2025]](https://www.devopstraininginstitute.com/blog/uploads/images/202510/image_140x98_68e3a84652312.jpg)


