


![Kong Interview Preparation Guide [2025]](https://www.devopstraininginstitute.com/blog/uploads/images/202509/image_430x256_68dbb95326997.jpg)


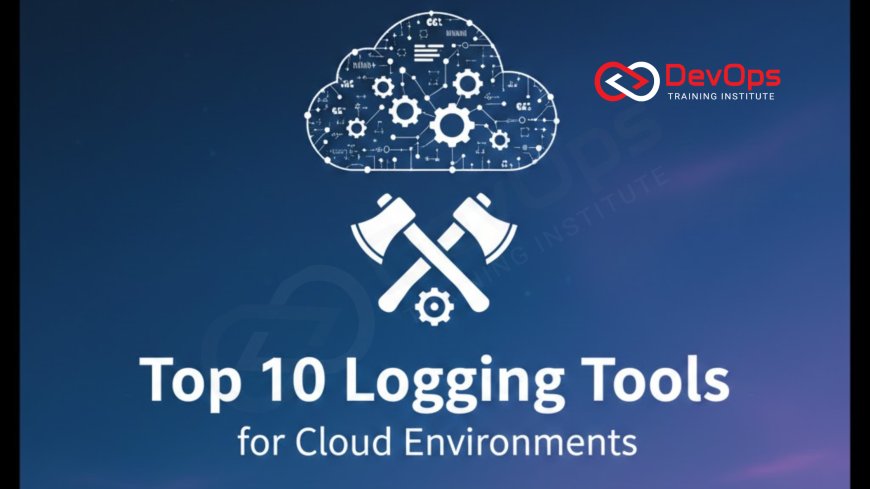
Top 10 Logging Tools for Cloud Environments
Centralized logging is non-negotiable for operational excellence and robust troubleshooting in the cloud, particularly when dealing with distributed microservices and ephemeral infrastructure. Discover the top 10 logging tools, including open-source standards like the ELK Stack, cloud-native solutions like CloudWatch and Azure Monitor, and commercial platforms such as Datadog and Splunk. This comprehensive guide helps you select the right tool to aggregate, analyze, and visualize logs from across your multi-cloud or hybrid environment, ensuring faster root cause analysis, improved observability, and better overall system health for accelerated software delivery pipelines.
Introduction
In the transition from monolithic applications running on a handful of static servers to distributed microservices deployed across dynamic cloud infrastructure, the nature of troubleshooting has fundamentally changed. Gone are the days of simply logging into a single server to view a local log file. Modern cloud environments, particularly those utilizing containers and serverless functions, produce an overwhelming volume of logs from countless sources, requiring a sophisticated and centralized approach to log management. Without a robust logging strategy, engineering teams are essentially operating blind, unable to quickly diagnose service degradation, track security incidents, or understand user behavior, directly undermining the speed and reliability gains promised by cloud adoption and the underlying DevOps methodology.
Effective centralized logging is not merely a mechanism for storing data; it is a critical component of the observability trifecta, alongside metrics and tracing, providing the essential context required for sophisticated root cause analysis and proactive operational maintenance. It enables teams to aggregate logs from disparate resources, standardize the data format, apply filtering and enrichment, and then visualize patterns and anomalies in near real-time. This capability moves log management from a reactive exercise into a powerful diagnostic tool, helping teams respond faster to incidents and continuously improve the health and performance of their cloud-native applications, which is essential for maintaining a competitive edge in product delivery.
The Critical Need for Centralized Logging
The ephemeral nature of cloud resources, especially within container orchestration platforms like Kubernetes, means that the logs produced by a workload can disappear the moment that workload terminates. This transient behavior necessitates a logging tool that can reliably collect and transmit logs off the host machine before they vanish, guaranteeing that a complete record of every transaction and system event is preserved for later analysis and auditing. If a microservice crashes and its container is immediately terminated, the log data stored locally on that container is lost without an effective forwarder in place to capture it beforehand.
Furthermore, centralized logging is vital for achieving unified visibility in environments that utilize a multi-cloud or hybrid strategy, which is increasingly common among large enterprises. When different application components are spread across AWS, Azure, and perhaps an on-premise data center, engineers require a single pane of glass to view and search all associated logs seamlessly. This unification is impossible if each component relies on its host platform's proprietary logging tools alone. The chosen tool must be platform-agnostic or have strong connectors to bridge these disparate environments, allowing for uniform querying and alerting across the entire infrastructure footprint.
Beyond operational concerns, centralized log management is a non-negotiable requirement for robust security and compliance. Logs serve as the primary source of truth for forensic analysis, audit trails, and intrusion detection, making their immutable collection and secure retention mandatory under regulations like HIPAA, GDPR, or PCI DSS. A centralized system ensures that log data is protected from tampering, retained for the required duration, and easily accessible during security investigations or regulatory audits, proving that logging is an integral part of the DevSecOps model rather than just an operational necessity for application performance.
Open Source King: The ELK Stack
The ELK Stack, which stands for Elasticsearch, Logstash, and Kibana (often referred to as the Elastic Stack), remains the undisputed open-source standard for centralized logging in cloud environments. Its popularity stems from its scalability, flexibility, and the ability to handle massive data volumes while being entirely customizable. This powerful combination of tools provides everything needed to ingest, store, search, and visualize log data from countless sources, making it a critical choice for organizations prioritizing cost control and granular control over their data stack, even with the steep learning curve it presents to beginners.
The components work together seamlessly, with Logstash acting as the ingestion pipeline, responsible for collecting logs, transforming them, and enriching them with context before sending them to the storage layer. Elasticsearch, an open-source search and analytics engine based on Apache Lucene, then serves as the durable, highly performant data store for indexing the logs and allowing complex, near real-time searches across billions of log lines. Finally, Kibana provides the web-based user interface for querying, creating dynamic dashboards, and visualizing trends, turning raw log data into actionable operational intelligence that developers and operations teams can easily consume.
Cloud-Native Logging Solutions
For organizations firmly committed to a single cloud provider, the native logging solutions offer deep integration, minimal setup overhead, and a pay-as-you-go cost model that is often highly efficient. These tools are inherently designed to collect logs, metrics, and events from all resources running within their respective cloud platforms, simplifying the initial steps of log collection and making them attractive starting points for smaller teams or those not needing a multi-cloud strategy. However, their primary drawback is the strong vendor lock-in they enforce, as transitioning to another system later requires complex data migration and pipeline reengineering, which can prove costly and time-consuming in the long run.
AWS CloudWatch: Amazon CloudWatch is the native monitoring and observability service for AWS, offering centralized log aggregation via CloudWatch Logs. It seamlessly collects logs from EC2 instances, Lambda functions, containers, and services like VPC Flow Logs, automatically integrating them with other AWS features. Its strength lies in its ability to quickly set up metric filters and create alarms directly from log data, enabling automated responses to critical events without the need for external tools. CloudWatch's close integration with the entire AWS ecosystem is unparalleled, making it highly effective for those strictly within the Amazon cloud footprint, providing immediate visibility and fast incident response.
Azure Monitor: Azure Monitor serves a similar role for Microsoft Azure environments, providing a consolidated platform for collecting, analyzing, and acting on telemetry data from both cloud and on-premise sources. Its Log Analytics feature, powered by a powerful Kusto Query Language (KQL), allows engineers to perform complex queries across aggregated log data from virtual machines, containers, and Azure services. Azure Monitor is particularly strong in security, integrating tightly with Azure Security Center for rapid threat detection and compliance auditing, thus positioning itself as a comprehensive solution for those focused on efficient Azure infrastructure management.
Table: Top 10 Logging Tools for Cloud Environments
The landscape of cloud logging is diverse, ranging from highly customizable open-source components to fully managed commercial platforms. This table summarizes the top 10 tools, categorized by their primary function, highlighting their key characteristics in a modern cloud-native environment. Selecting the correct tool requires balancing implementation complexity, feature set, cost, and the need for multi-cloud support against your organization's specific technical requirements and engineering expertise.
| # | Tool Name | Category | Primary Cloud Role |
|---|---|---|---|
| 1 | Elasticsearch | Open Source Storage/Search | Scalable, distributed storage and real-time indexing for logs. |
| 2 | Logstash | Open Source Ingestion Pipeline | Collects, processes, enriches, and transforms log data before storage. |
| 3 | Kibana | Open Source Visualization | Web-based UI for querying, visualizing, and dashboarding log data. |
| 4 | AWS CloudWatch | Cloud-Native Platform | Unified monitoring and logging exclusively within the AWS ecosystem. |
| 5 | Azure Monitor | Cloud-Native Platform | Log Analytics and deep integration for Microsoft Azure workloads. |
| 6 | Fluentd | Log Collector/Forwarder | Unified logging layer for collecting and routing logs to various destinations. |
| 7 | Fluent Bit | Lightweight Collector/Forwarder | Optimized for high performance and low resource usage, especially in container environments. |
| 8 | Datadog | Commercial Observability Platform | Combines logs, metrics, and traces for full-stack, correlated visibility. |
| 9 | Splunk | Commercial Data Analytics | Industry leader for massive-scale log ingestion, search, and security intelligence. |
| 10 | Logz.io | Managed ELK Service | Provides ELK-as-a-Service with added AI/ML features for proactive alerting. |
Lightweight Data Collectors
In modern cloud architectures, particularly those built around Kubernetes or edge computing, the application of lightweight, dedicated data collectors has become a fundamental best practice for reliable log transport. These agents are installed on every host, virtual machine, or container, and their sole job is to tail the local log files and instantly forward the data stream to a centralized logging system. Their minimal resource footprint, often referred to as low overhead, is essential to ensure that the logging process itself does not negatively impact the performance of the critical application workload, which is a major concern when deploying thousands of tiny service instances that require high throughput log handling.
These agents are pivotal for ensuring all data is captured before ephemeral resources are terminated:
Fluentd: Officially a Cloud Native Computing Foundation (CNCF) project, Fluentd acts as a unified logging layer, abstracting the source and destination of log data. It is highly configurable, supporting over 100 different log sources and outputs, making it an excellent choice for complex hybrid and multi-cloud environments. Fluentd collects event data, applies complex tag-based routing, and can perform filtering and transformation on the fly before routing the standardized output to systems like Elasticsearch, S3, or Splunk, providing powerful, flexible data routing capabilities.
Fluent Bit: This tool is the lightweight and high-performance sibling of Fluentd, optimized specifically for containerized and embedded Linux environments where resource efficiency is paramount. Fluent Bit is perfect for deployment as a DaemonSet on Kubernetes, ensuring that one instance runs on every node to reliably collect container logs and forward them with minimal CPU and memory usage. Its focus on speed and low latency makes it the preferred initial log collector for high-volume, performance-critical cloud workloads, minimizing application impact while maximizing data integrity and ensuring that the automation pipeline remains reliable.
Commercial Full-Service Observability Platforms
For organizations seeking a single, integrated platform that combines logs, metrics, and traces into a cohesive "single pane of glass" experience, commercial observability platforms provide managed solutions with advanced features. While they come with a higher cost and typically a consumption-based pricing model, they eliminate the need to manage the complex self-hosted stack required by open-source solutions like ELK, and offer powerful correlation and machine learning capabilities out of the box. These tools are often preferred by enterprise teams looking to maximize engineering velocity by offloading operational responsibility for the monitoring stack entirely.
Datadog: Datadog has emerged as a leader in cloud monitoring, offering a comprehensive platform that ties logs directly to performance metrics and traces. Datadog's proprietary agent is easy to deploy across various cloud and container platforms and is designed to automatically ingest, process, and correlate all three pillars of observability data. Its unique Log Management solution focuses heavily on pattern detection, allowing engineers to quickly identify recurring issues and utilize machine learning to suggest optimal facets for searching, streamlining the troubleshooting process significantly. This seamless correlation capability is a massive advantage over disparate, self-managed tools.
Splunk: Splunk remains an industry giant, renowned for its massive scalability and sophisticated capabilities in log aggregation and security information and event management (SIEM). Splunk is often the choice for large enterprises with enormous log data volumes and complex compliance needs, offering powerful search processing language (SPL) for deep data analysis. While historically known for its high licensing costs and heavy deployment, Splunk Cloud now provides a managed service, allowing teams to leverage its core strength in data ingestion and analysis without the burden of self-managing the underlying infrastructure, thus catering to modern enterprise requirements while maintaining its analytical power.
Logz.io: Logz.io offers the ELK Stack as a fully managed service, which is a significant value proposition for teams that want the power and flexibility of the open-source solution without the operational overhead of managing Elasticsearch clusters. By adding features like AI-powered anomaly detection and threat intelligence feeds on top of the open-source core, Logz.io provides advanced features that enable proactive alerting and simplified investigation. It perfectly bridges the gap between the cost-effectiveness and transparency of open-source tools and the convenience and advanced features of commercial platforms, often accelerating the time-to-value for teams adopting the popular open-source stack.
The Importance of Log Standardization
Regardless of the tool chosen, the effectiveness of any centralized logging system relies heavily on the principle of log standardization. Cloud environments often aggregate logs from dozens of services, which natively produce data in wildly different formats, making unified querying and analysis virtually impossible. A fundamental best practice is to structure all log entries into a standardized format, most commonly JSON, using defined fields for critical information such as timestamp, service name, environment, log level, and unique request ID. This standardization should ideally occur at the log collection or ingestion stage, using tools like Logstash or Fluentd to parse and enrich the data.
This commitment to structure not only makes searching fast and efficient but is also crucial for enabling log correlation and tracing. By ensuring a unique transaction ID is included in every log line across all microservices involved in a single user request, engineers can trace the entire flow of that request through the distributed architecture, simplifying root cause analysis from hours to minutes. This level of discipline in logging is a hallmark of a mature DevOps culture, where developers treat logging as seriously as they treat application code, providing immediate and massive operational dividends in the form of reduced MTTR.
Advanced Practices: Scaling and Retention
Scaling a logging solution in a dynamic cloud environment presents unique architectural challenges, primarily centered on balancing cost, performance, and long-term retention requirements. As microservice environments grow, log volumes often scale exponentially, quickly leading to massive indexing costs in tools like Elasticsearch or commercial platforms. An advanced strategy involves implementing a tiered storage architecture to manage this financial and technical burden, ensuring that high-value, recent data remains performant while bulk older data is retained affordably for compliance and historical analysis.
This typically involves sending all incoming logs to a high-performance indexing layer for immediate analysis (e.g., Elasticsearch, Datadog), but concurrently or subsequently archiving the raw data to a much cheaper, durable object storage service like AWS S3 or Azure Blob Storage. Logs in the cold archive can still be retrieved and re-indexed on demand for deep historical investigations or audits, but they do not incur the high operational cost of active querying. Implementing retention policies that automatically transition logs based on their age and sensitivity is essential for financial stewardship and regulatory compliance, transforming logging from a financial burden into a sustainable, cost-optimized operational asset.
Conclusion
Centralized logging is the bedrock of operational visibility in the cloud and an indispensable practice for any modern engineering organization practicing DevOps. The array of tools available, from the customizable power of the open-source ELK Stack to the deeply integrated capabilities of cloud-native solutions like CloudWatch and Azure Monitor, and the all-in-one convenience of commercial platforms, ensures that there is a logging solution tailored to every technical and budgetary requirement. The key to success lies not only in selecting the right tool but also in the disciplined adherence to log standardization, efficient collection via lightweight forwarders, and strategic tiered storage for cost control.
Ultimately, the most effective logging strategy transcends mere collection; it leverages the data to drive continuous improvement, accelerate incident response, and ensure robust security and compliance. By adopting a centralized, systematic approach to log management, engineering teams gain the clarity and context needed to operate complex, distributed cloud systems at high velocity and with unwavering reliability, guaranteeing that the promises of cloud agility are met by stable, observable, and fully auditable operations.
Frequently Asked Questions
What is the main benefit of centralized logging in the cloud?
The main benefit is the ability to quickly search, correlate, and analyze logs from all distributed resources in one unified location for faster troubleshooting.
What does the "E" in the ELK Stack stand for?
The "E" in the ELK Stack stands for Elasticsearch, which is the distributed, scalable search and analytics engine used for log storage.
What is the primary function of a log collector like Fluentd?
Its primary function is to reliably collect log data from the source and efficiently route it to a centralized storage and analysis destination.
Why do containers require a special logging approach?
Containers are ephemeral, meaning their logs disappear when they stop; collectors must extract logs before the container terminates.
Is CloudWatch a good choice for multi-cloud logging?
CloudWatch is excellent for AWS-only environments but is generally not suitable for environments that span multiple distinct cloud platforms.
What is log enrichment?
Log enrichment is the process of adding valuable context, such as geo-location or user ID, to raw log data during the ingestion pipeline.
What is the difference between Fluentd and Fluent Bit?
Fluent Bit is the lightweight, resource-optimized collector designed primarily for container and performance-critical environments.
What is the importance of a unique Request ID in logging?
A Request ID allows engineers to correlate all log lines related to a single user request across multiple microservices for tracing.
How does log standardization simplify analysis?
It converts messy logs into a consistent format, like JSON, enabling powerful and efficient searches using defined fields and values.
What is Logz.io?
Logz.io is a commercial, fully managed service that provides the core features of the open-source ELK Stack with added AI/ML capabilities.
Should all logs be stored in an active, searchable database?
No, only recent, high-value logs should be active; older logs should be archived to cheaper storage like S3 for cost optimization.
What is KQL?
KQL stands for Kusto Query Language, the powerful search language used by Azure Monitor's Log Analytics feature for deep data querying.
What is the role of Splunk in security?
Splunk is widely used as a SIEM tool, combining log analysis with security intelligence to detect and investigate threats proactively.
What are the three pillars of observability?
The three pillars of observability are logs, metrics (time-series data), and tracing (tracking request flow), which are often managed together.
Can I use a tool like Datadog to replace my self-hosted ELK stack?
Yes, commercial platforms like Datadog are designed to replace the need to manage complex, self-hosted open-source logging infrastructure.
What's Your Reaction?
 Like
0
Like
0
 Dislike
0
Dislike
0
 Love
0
Love
0
 Funny
0
Funny
0
 Angry
0
Angry
0
 Sad
0
Sad
0
 Wow
0
Wow
0


![100+ Azure DevOps Interview Questions and Answers [Updated 2025]](https://www.devopstraininginstitute.com/blog/uploads/images/202509/image_140x98_68c40aa9a3834.jpg)


![Future Scope of DevOps Careers in Pune [Updated 2025]](https://www.devopstraininginstitute.com/blog/uploads/images/202510/image_140x98_68e3a84652312.jpg)


