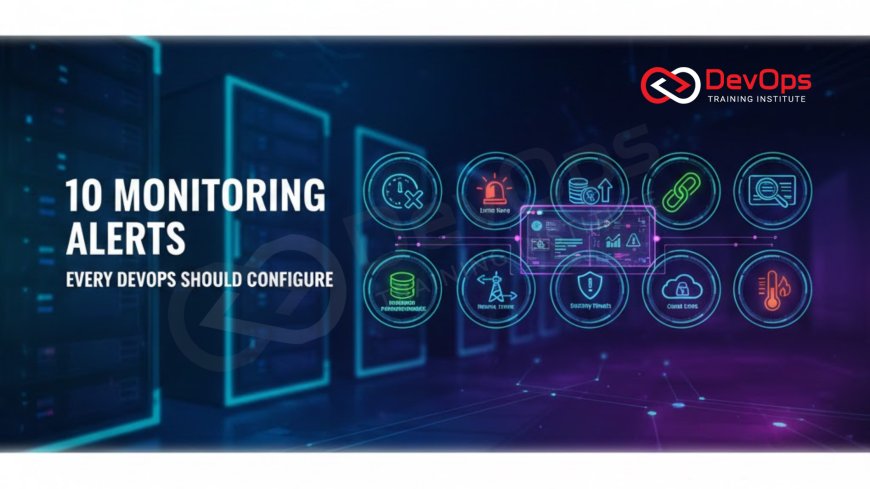
10 Monitoring Alerts Every DevOps Should Configure
Master the art of proactive incident management by configuring the 10 most critical monitoring alerts essential for any DevOps team managing modern, highly available applications. This comprehensive guide covers everything from core Golden Signals like latency and error rates to advanced alerts for resource saturation, dependency failures, and security-related anomalies. Learn to optimize alert thresholds, reduce notification fatigue, and implement self-healing mechanisms to ensure peak application performance and reliability in any scale, from a single application to a complex microservices architecture, transforming your reactive operations into a predictive engineering practice.

Introduction to Proactive Monitoring and Alerting
In the world of DevOps and Site Reliability Engineering, the mantra is simple: if you cannot measure it, you cannot improve it. Monitoring is the eye that watches over the complex infrastructure and applications that modern business relies on, providing the crucial data needed to maintain performance and availability. Alerting is the immediate, actionable output of that monitoring, the signal that transforms raw data into a call to action. An effective alerting strategy is the bedrock of rapid incident response, distinguishing a resilient team from one that constantly struggles with downtime.
The challenge for many organizations is not a lack of data, but an overwhelming abundance of it. Simply monitoring everything leads to "alert fatigue," where operations teams are flooded with notifications that mask genuinely critical issues. A truly successful monitoring approach focuses on what matters most: the user experience and the core application health indicators. By configuring the right alerts with intelligent thresholds, DevOps teams can ensure that they are only notified when a service is genuinely degrading or about to fail, allowing them to focus on prevention and resolution rather than noise.
This comprehensive guide details the ten most vital monitoring alerts that every DevOps professional should configure, covering the full spectrum of application, infrastructure, and business-level health. These alerts move beyond simple uptime checks to focus on performance, resource utilization, and key dependencies. Implementing these alerts correctly will transform your team from being reactive firefighters into proactive engineers, ensuring that problems are often resolved before the customer even notices an issue. Mastering these alerts is a critical step towards achieving high-level service availability.
Alert the Golden Signals Application Health
The Golden Signals, a core concept from Site Reliability Engineering, represent the four key metrics that matter most for any user-facing service: Latency, Traffic, Errors, and Saturation. Configuring alerts based on these signals provides the most direct measure of the customer experience. The goal is to detect deviations in these signals that suggest performance degradation or an impending failure, ensuring your focus is always on the metrics that directly impact the business and the end user. Alerting on all four provides a holistic view of application health that simple "server up or down" checks cannot achieve.
The first critical alert is focused on Latency, specifically the P95 or P99 response time. This means alerting when 5% or 1% of user requests are taking too long to complete. A gradual increase in the 95th percentile latency is a strong early indicator of performance degradation, which might be caused by database bottlenecks, inefficient code, or network issues. Setting a threshold that corresponds to a noticeable drop in user experience is essential here. Alerting on average latency is often misleading because a few very slow requests can be averaged out by many fast ones, hiding a real user problem.
The second and third critical alerts are for Traffic and Errors. A sudden, unexplained drop in traffic can indicate a major upstream failure, such as a DNS problem or load balancer issue, preventing users from reaching the service. Conversely, a spike in the Error Rate (HTTP 5xx responses) is a clear sign of application or backend failure. The alert should be configured to fire not just on a high absolute error count, but on the ratio of errors to total requests, for example, 5% of requests resulting in a server error over a five-minute window. This ratio provides a more meaningful indicator of service health in the highly dynamic production environment.
Resource Saturation and Capacity Planning
The fourth Golden Signal, Saturation, often translates directly into alerts for resource utilization metrics on the underlying infrastructure. These alerts are predictive, warning the team that they are running out of capacity before the user experience is impacted. Key saturation alerts include CPU utilization, memory usage, and disk Input/Output (I/O) throughput. When any of these metrics consistently exceed a high threshold, such as 85% to 90%, it signals that the servers or containers are nearing their limit and are likely to start throttling requests or crashing.
A specialized saturation alert that every DevOps team needs is the Disk Usage Forecast. Applications running on a file system that runs out of space will inevitably crash or stop logging, severely hindering troubleshooting. Instead of alerting when the disk is already 95% full, a predictive alert should be configured. This alert triggers when the disk usage trend suggests the volume will reach 90% capacity within a defined future period, perhaps 48 hours, based on the current rate of consumption. This provides the necessary window for the operations team to scale up resources or clean up logs proactively.
Another crucial capacity alert involves Connection Pool Exhaustion, particularly for databases. Modern applications rely on connection pooling to manage the link between the application and the database efficiently. An alert should fire when the connection pool utilization rate gets too high, indicating a high volume of concurrent database requests that the pool cannot handle. This situation is an early sign of resource contention that will soon manifest as high latency or connection errors. Configuring this alert allows the team to tune the pool size or address the underlying application code generating too many connections before a complete database outage occurs.
Alerts for Dependency and External Service Failures
The fifth and sixth vital alerts focus on the complex web of dependencies inherent in microservices and cloud architectures. Services rarely run in isolation; they depend on databases, message queues, caching layers, and external third-party APIs. A failure in a downstream service can cascade and take down the entire application, making dependency monitoring crucial. The fifth alert is for Database Health and Slow Queries. This involves setting alerts for core database metrics such as high transaction latency, excessive deadlocks, or a sudden drop in the database's available connections. A slow query alert, which triggers when a specific critical query takes longer than its established baseline (e.g., 500ms), is a powerful proactive measure to prevent application slowdowns.
The sixth alert is for External Service or API Failure Rate. When a critical external service, such as a payment gateway, identity provider, or geo-location service, starts returning an increased percentage of errors (e.g., 4xx or 5xx HTTP codes), your application's functionality is directly impacted. This alert needs to be fine-tuned to differentiate between transient errors and systemic failures. It is often configured using a moving average over a period of time to filter out noise, ensuring the team is only alerted when a genuine external outage is occurring that requires immediate attention or failover implementation. These dependency alerts help pinpoint the source of a user-facing problem instantly.
It is important to remember that these dependency alerts need to be coupled with tracing tools. When an alert fires for an external service failure, the DevOps team should be able to instantly drill down into distributed tracing data. Tracing visually represents the entire request path through the services, identifying the specific hop where the latency spike or error originated. This context is invaluable for determining if the issue lies within the local application's interaction with the dependency or if the dependency itself is globally unavailable on the cloud platform.
Core Comparison of Reactive vs. Proactive Alerting
The transition from a reactive monitoring strategy to a proactive one is the hallmark of a mature DevOps organization. Reactive monitoring only tells you when a catastrophic failure has already occurred, impacting customers. Proactive monitoring, however, signals when the system is approaching a failure state, giving the team time to intervene. The right alerts are the primary mechanism for this transition, as they shift the focus from recovery time to prevention time.
| Alert Type | Metric Monitored | Impact | Proactive or Reactive |
|---|---|---|---|
| High P95 Latency | Application response time (95th percentile). | Degraded user experience; slow application. | Proactive (Detects degradation before total failure). |
| Error Rate Spike | Ratio of 5xx errors to total requests. | Service malfunction; requests failing. | Reactive/Early Warning (Immediate indicator of failure). |
| Disk Space Forecast | Projected time until disk hits critical capacity. | Potential crash due to inability to write logs/data. | Highly Proactive (Predicts failure days in advance). |
| Process Not Running | The presence of a critical application process. | Service is completely offline or unavailable. | Reactive (The failure has already happened). |
| High Container Restarts | Frequency of container crashes/restarts. | Application instability, possibly memory leaks. | Proactive (Signals health issues before total crash). |
Log Volume and Security Anomalies
The seventh alert focuses on Log Volume Spikes or Drops. Logs are the detailed narratives of what the application and operating system are doing, and a sudden change in their generation rate is often a potent sign of trouble. A huge spike in log volume (e.g., 5x the normal rate) usually indicates a runaway process, an infinite loop, or an application error bombarding the logging system. This can quickly exhaust disk space or exceed logging service quotas, impacting application stability.
Conversely, a sudden, sharp drop in log volume is equally alarming. This suggests that a critical application process has stopped writing logs, or worse, has crashed entirely, preventing any visibility into its activities. This alert is an excellent way to detect silent failures that might be masked by load balancers still routing traffic to a seemingly healthy instance. Configuring this alert requires baselining the normal log ingestion rate and alerting on any deviation that falls outside of two or three standard deviations from the mean.
The eighth alert addresses Security and Error Log Patterns. While security teams use specialized tools, DevOps teams must configure alerts for critical security-related events visible in standard application logs. These include repeated failed login attempts from a single IP, a high volume of unauthorized access attempts (HTTP 401/403 errors), or the appearance of application-specific security keywords like "SQL Injection" or "Cross-Site Scripting." By alerting on these patterns, the team can respond immediately to potential attacks or security policy violations before they escalate into a full breach.
Container Health and Orchestration Alerts
For organizations utilizing container orchestration platforms like Kubernetes, two specific alerts are indispensable for maintaining service reliability. These alerts move beyond simple host monitoring to focus on the ephemeral nature of containerized workloads, which is where many modern failures originate. The ninth alert is for High Container Restart Rate. When a container crashes and is restarted by the orchestrator (Kubernetes or ECS), it signifies an underlying issue such as an out-of-memory error, an unhandled exception, or a failed liveness/readiness probe. While the orchestrator handles the recovery, a persistent high rate of restarts means the application is unstable and impacting user experience.
The alert should be configured to track the number of container restarts for a specific deployment over a short period. If this count exceeds a low threshold (e.g., 5 restarts in 10 minutes), it warrants immediate investigation. This metric helps distinguish between a one-off issue and a systemic application stability problem. Paired with metrics on resource usage, this alert often quickly points to a memory leak or a deployment configuration error in the environment that needs human intervention beyond the scope of automated recovery.
The tenth alert is for Orchestration System Health. This is a meta-alert that tracks the health of the scheduler, control plane, and underlying networking components that power the entire container cluster. For example, in Kubernetes, alerting on the unresponsiveness of the API system or a persistent node being marked as "Not Ready" is essential. If the orchestration layer itself fails, automated scaling, deployment, and healing mechanisms cease to function, potentially leading to a massive outage that affects every service running on the cluster. This is the ultimate "safety net" alert for complex, multi-component distributed systems and highlights the importance of monitoring the full stack, including the virtualization layer.
The Cultural Aspect of Alert Management
Implementing these ten technical alerts is only half the battle. The other, equally important half is establishing a healthy culture and effective process around alert management. A poorly managed alerting system can destroy team morale and lead to burnout. The goal is to move from simply receiving alerts to acting on alerts that are meaningful, actionable, and not repetitive. This involves continuously tuning thresholds to minimize false positives, a process that requires collaboration between the engineering team and the product owners to define acceptable service levels.
DevOps teams must implement clear, documented runbooks for every alert they configure. A runbook provides a step-by-step guide for responding to a specific alert, detailing who needs to be contacted, what the immediate remediation steps are (e.g., scale up resources, restart a service), and where to find the necessary diagnostic information (logs, dashboards). Without a runbook, even a perfectly configured alert results in confusion and slow response times. A good runbook is the difference between a minor incident and a prolonged outage.
Furthermore, the team should regularly review past alerts in a blameless post-mortem setting. The purpose of this review is not to assign blame, but to ask: "Could this incident have been prevented by a different alert configuration?" and "How can we automate the response to this alert next time?" This commitment to continuous improvement leads to the development of self-healing systems, where simple, known issues trigger automated responses—such as autoscaling or rolling back a deployment—before a human is even notified, dramatically increasing the overall resilience and stability of the application.
Conclusion and Summary of Alert Strategy
Effective monitoring and alerting are indispensable practices that separate high-performing DevOps organizations from the rest. By focusing on the ten critical alerts outlined in this guide—from the foundational Golden Signals of Latency, Errors, Traffic, and Saturation to the vital checks for Dependency Failures, Log Volume, and Orchestration Health—teams can gain the necessary visibility to maintain service level objectives (SLOs) and deliver exceptional user experiences. These alerts provide the signal needed to cut through the noise of constant data generation.
The strategic value of these alerts lies in their proactive nature. They are designed to trigger before the customer experiences the failure, allowing the team to intervene with surgical precision. Configuring these alerts, tuning the thresholds diligently, and coupling them with clear runbooks transforms reactive operations into a predictive and automated engineering discipline. This effort reduces the mean time to resolution (MTTR), minimizes the frequency of incidents, and ultimately fosters a culture of reliability and high availability. Adopting these 10 alerts is the single most impactful step a DevOps team can take to mature its operational practices and ensure continuous service delivery.
Frequently Asked Questions
What are the four Golden Signals in monitoring?
The four Golden Signals are Latency, Traffic, Errors, and Saturation. They provide a comprehensive view of service health and user experience.
Why is P95 Latency a better alert than Average Latency?
P95 latency reveals the experience of the majority of your slowest users, while the average can hide significant performance bottlenecks.
What is alert fatigue and how can it be avoided?
Alert fatigue is when teams ignore alerts due to too much noise. It is avoided by continuously tuning thresholds and minimizing false positives.
What is a runbook in the context of alerting?
A runbook is a documented, step-by-step guide detailing the necessary actions to take when a specific monitoring alert is triggered.
Should every service have an alert for error rate?
Yes, monitoring the ratio of errors to total requests is a universal and essential indicator of application instability for any service.
How do I monitor disk usage proactively?
Instead of alerting on current usage, use an alert that forecasts when the disk will reach critical capacity based on historical growth rates.
Why are external dependency alerts so important?
They alert the team when an external service or API, vital for the application, is failing, preventing cascading system failures.
What does high container restart rate typically indicate?
It typically indicates application instability, such as a memory leak, unhandled exceptions, or failing health checks in the container.
What is the benefit of monitoring log volume changes?
A sudden change in log volume is a powerful indicator of a runaway process or a silent failure, providing immediate system health feedback.
What is the difference between an alert and a warning?
An alert is an actionable notification of a critical issue, while a warning signals a non-critical threshold that should be observed.
Why is monitoring the orchestrator control plane vital?
Failure of the control plane (e.g., Kubernetes API) means all automated scaling and self-healing mechanisms are compromised.
What is an example of a security anomaly alert?
An example is an alert triggered by a large number of failed login attempts from a single source within a short time window.
How should alerts be linked to self-healing?
Simple, known alerts should trigger automated actions, like restarting a service or scaling up resources, before human intervention is needed.
How does monitoring connect to the operating system health?
Alerts for CPU, memory, and disk utilization track the resource capacity of the underlying host system itself.
Should I alert on 100% CPU usage?
No, you should alert when CPU usage consistently hits a high threshold, like 85-90%, to allow time for scaling before saturation.
What's Your Reaction?
 Like
0
 Dislike
0
 Love
0
 Funny
0
 Angry
0
 Sad
0
Sad
0
 Wow
0
Wow
0


![Kong Interview Preparation Guide [2025]](https://www.devopstraininginstitute.com/blog/uploads/images/202509/image_430x256_68dbb95326997.jpg)


![100+ Azure DevOps Interview Questions and Answers [Updated 2025]](https://www.devopstraininginstitute.com/blog/uploads/images/202509/image_140x98_68c40aa9a3834.jpg)


![90+ Git and GitHub Interview Questions [2025]](https://www.devopstraininginstitute.com/blog/uploads/images/202509/image_140x98_68c40a7931d60.jpg)


![Future Scope of DevOps Careers in Pune [Updated 2025]](https://www.devopstraininginstitute.com/blog/uploads/images/202510/image_140x98_68e3a84652312.jpg)


