


![Kong Interview Preparation Guide [2025]](https://www.devopstraininginstitute.com/blog/uploads/images/202509/image_430x256_68dbb95326997.jpg)


14 DevOps Debugging Strategies for Cloud Systems
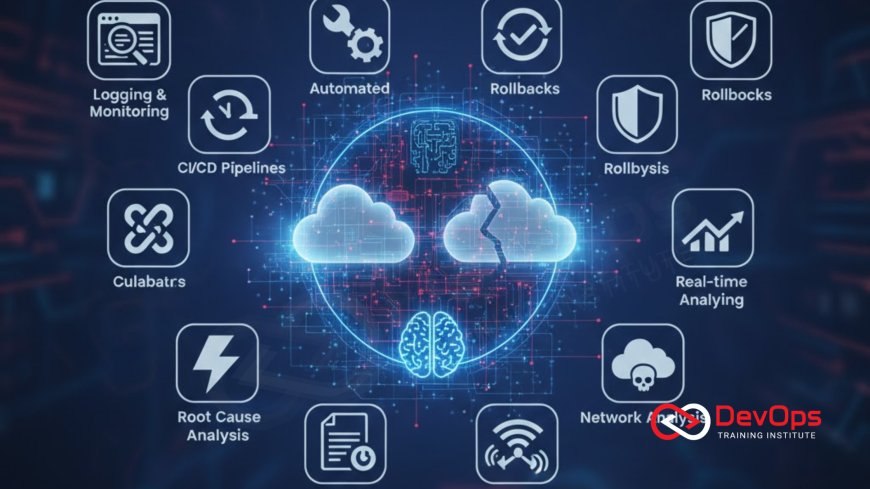
In 2026, the complexity of distributed systems demands a more sophisticated approach to identifying and resolving technical issues. This guide outlines fourteen essential DevOps debugging strategies tailored for modern cloud systems, covering advanced observability, AI-driven anomaly detection, and automated root cause analysis. Learn how to navigate microservices chaos with distributed tracing, implement self-healing infrastructure, and bridge the gap between development and operations through platform engineering. These techniques are designed to reduce Mean Time to Recovery (MTTR) and improve the overall resilience of your digital infrastructure, ensuring that your engineering team can maintain peak performance and security in an increasingly automated and complex global software market today.
Introduction to Modern Cloud Debugging
Debugging in the cloud has evolved from a simple task of checking local logs to a complex orchestration of data analysis across thousands of distributed components. As we move into 2026, the "it works on my machine" era is long gone, replaced by ephemeral environments where a service might exist for only seconds. To effectively debug these systems, DevOps professionals must adopt a proactive mindset, treating observability not just as a monitoring tool but as a fundamental part of the development lifecycle. This shift requires a deep understanding of how various cloud layers interact, from the physical network to the serverless function execution.
Modern debugging is less about finding a specific line of code and more about understanding system behavior under load. With the rise of AIOps and AIOps-powered automation, engineers are now equipped with tools that can surface hidden patterns and predict failures before they happen. However, the human element remains critical; the ability to interpret these insights and apply strategic fixes is what differentiates a top-tier DevOps team. This guide provides fourteen actionable strategies to master the art of cloud debugging, ensuring your systems remain robust, secure, and highly available in a demanding technical landscape.
Strategy One: Implementing Observability 2.0
Observability 2.0 represents a significant leap forward from traditional monitoring by integrating logs, metrics, and traces into a single, cohesive data model. Instead of looking at disconnected dashboards, engineers can now use AI and machine learning to correlate signals across the entire stack. This high-definition view allows you to see the "why" behind an error, not just the "what." By adopting continuous verification as part of your observability strategy, you ensure that every deployment is measured against its intended performance baseline in real-time.
This approach involves moving away from static thresholds toward dynamic, context-aware alerting. For example, a sudden spike in latency might be normal during a scheduled database maintenance window but critical during peak user traffic. Observability 2.0 platforms use causal analysis to help teams quickly isolate the root cause among millions of events. This reduces alert fatigue and allows engineers to focus on genuine issues that impact the user experience. It is a cornerstone of modern reliability engineering, providing the deep visibility needed to manage the inherent complexity of distributed cloud-native platforms effectively.
Strategy Two: Distributed Tracing for Microservices
In a microservices architecture, a single user request can pass through dozens of different services, making it nearly impossible to debug using traditional logs alone. Distributed tracing solves this by assigning a unique ID to every request, allowing you to follow its journey through the entire system. This visibility is essential for identifying bottlenecks and errors that occur at the boundaries between services. By utilizing GitOps to manage your tracing configurations, you ensure that your instrumentation is as version-controlled and predictable as your application code.
Effective tracing requires consistent context propagation across all your services, regardless of the language or framework used. Tools like OpenTelemetry have become the industry standard for this, providing a unified way to collect and export trace data. When a failure occurs, a trace can reveal exactly which service hop failed and why, saving hours of manual investigation. This technique is particularly powerful for debugging asynchronous pipelines and serverless cold starts, where traditional debugging methods often fall short. It turns the "chaos" of microservices into a clear, visual map of system interactions.
Strategy Three: Automated Root Cause Analysis (RCA)
Root Cause Analysis is often the most time-consuming part of incident response, but in 2026, it is increasingly being automated. Advanced RCA workbenches use knowledge graphs and AI to automatically stitch together events, logs, and traces into a coherent timeline of failure. This allows teams to move from "where is the fault" to "what to fix" in minutes rather than hours. By integrating ChatOps techniques, these automated insights can be delivered directly to the team's primary communication channels, facilitating instant collaboration during a crisis.
Automation doesn't replace the need for the "5 Whys" method, but it provides the data needed to answer those questions accurately. A modern RCA tool can identify that a production breach was due to a vulnerable container, which was missed because of a failing security gate in the CI/CD pipeline. This level of detail helps teams implement corrective actions that address the underlying process or policy failure, not just the immediate technical symptom. Automated RCA is a vital part of building a learning culture where every incident is an opportunity to improve the overall resilience of the software delivery lifecycle.
Cloud Debugging Toolsets Comparison 2026
| Tool Type | Core Capability | Example Platforms | Best For |
|---|---|---|---|
| Observability | Unified Logs & Traces | Datadog, Dynatrace, Honeycomb | Enterprise Microservices |
| AIOps Tools | Anomaly Detection | Moogsoft, BigPanda | Predictive Maintenance |
| Cloud-Native | Cluster Troubleshooting | kubectl, Lens, groundcover | Kubernetes Operations |
| RCA Platforms | Event Correlation | Grafana RCA, OverOps | Rapid Incident Triage |
| Local Debugging | Cloud Proxies | Telepresence, Nocalhost | Shortened Feedback Loops |
Strategy Four: Local-to-Cloud Proxy Debugging
One of the biggest hurdles in cloud debugging is the slow development loop; deploying to the cloud just to test a one-line fix is incredibly inefficient. Proxy tools like Telepresence allow you to bridge your local development environment with a remote Kubernetes cluster. This means your local service can interact with other services in the cluster as if it were running there, allowing for real-time debugging in your favorite IDE. It effectively removes the "wall" between your computer and the cloud, making distributed systems feel as manageable as local monoliths.
This strategy also allows you to use your local debugger to pause execution and inspect variables in a production-like environment without affecting other users. By utilizing who drives cultural change strategies, engineering leaders can encourage the use of these tools to shorten the feedback cycle. Proxy debugging ensures that developers can find and fix issues early in the process, reducing the number of bugs that reach production. It is a critical component of platform engineering, providing developers with the internal platforms they need to stay productive and focused on innovation.
Strategy Five: eBPF-Powered Zero-Code Observability
eBPF (Extended Berkeley Packet Filter) is a revolutionary technology that allows you to collect deep network and application metrics without changing a single line of your application code. By running directly in the Linux kernel, eBPF-powered tools can observe every system call, network packet, and file interaction. This "wire-level" context is invaluable for debugging performance issues that are hidden from higher-level monitoring tools. Choosing the right containerd runtime integration ensures that your eBPF agents have the visibility they need into every containerized workload.
The beauty of eBPF is its low overhead and its ability to provide zero-code auto-instrumentation. You get instant visibility into your entire cluster just by deploying an agent. This is particularly helpful for legacy applications that are difficult to instrument manually or for identifying "noisy neighbor" effects in a shared cluster. eBPF provides the ground-truth data needed for advanced incident handling and security auditing. It is a game-changer for DevOps teams managing massive, high-volume environments where agent sprawl and code-level changes are major operational burdens. By moving observability into the kernel, you gain a transparent and tamper-proof view of your entire system.
Critical Debugging Strategies for Cloud DevOps
- Standardize Environments: Use Infrastructure as Code (IaC) to ensure development, staging, and production are identical, eliminating "environment drift" bugs.
- Automate Evidence Gathering: Use scripts to automatically take memory snapshots or disk images during a suspected compromise for post-mortem analysis.
- Implement Feature Flags: Use flags to instantly disable problematic features in production without requiring a full code rollback or redeploy.
- Security-First Debugging: Integrate secret scanning tools into your debugging flow to ensure no credentials are exposed in logs or traces.
- Policy-as-Code Validation: Use admission controllers to block insecure or misconfigured resources from being deployed, preventing debugging issues at the source.
- Chaos Testing: Deliberately inject failures to verify that your debugging and recovery processes work as expected under real-world stress conditions.
- Leverage Service Meshes: Use tools like Istio to manage and monitor global traffic status, providing a high-level dashboard for problematic service interactions.
Building a robust debugging practice requires a mix of technical tools and process improvements. It is important to foster a blameless culture where the focus is on fixing the system rather than assigning fault. By using architecture patterns that prioritize observability, you make the toughest issues easier to find. As you refine your strategies, consider how AI-driven testing can further help by generating test scenarios in response to code updates. The goal is to create a seamless "paved road" where debugging is a natural and fast part of the engineering journey, not a painful interruption.
Conclusion: The Future of Cloud Reliability
In conclusion, the fourteen DevOps debugging strategies outlined in this guide provide a comprehensive framework for managing the complexities of 2026 cloud systems. From the kernel-level insights of eBPF to the high-level orchestration of AIOps and distributed tracing, these techniques empower teams to maintain high standards of reliability and security. The key to success is moving beyond isolated toolchains and embracing an integrated, platform-centric approach. By prioritizing observability and automation, you can ensure that your organization remains agile and resilient, capable of resolving incidents faster than ever before.
As we look toward the future, the integration of AI augmented devops will continue to redefine what is possible in system maintenance. Embracing release strategies that allow for safe, incremental changes will further reduce the risk of major outages. Ultimately, debugging is an art that requires both great tools and a curious, analytical mindset. By adopting these fourteen strategies today, you are preparing your team for the challenges of tomorrow, ensuring that your cloud infrastructure remains a powerful asset for your business in an increasingly digital and automated world.
Frequently Asked Questions
What is the main difference between monitoring and observability 2.0?
Monitoring tells you if a system is up, while observability 2.0 uses AI to explain why the system is behaving in a certain way.
How does distributed tracing help in a microservices environment?
It assigns a unique ID to each request, allowing you to follow its path through various services to find bottlenecks and errors easily.
Why is "environment drift" a problem for cloud debugging?
Differences between staging and production can cause bugs to appear only in live systems, making them incredibly difficult to reproduce locally for developers.
What role does eBPF play in modern observability?
eBPF allows for deep system visibility without changing application code by running observation scripts directly inside the Linux kernel with very low overhead.
Can I debug cloud services on my local computer?
Yes, tools like Telepresence and cloud emulators allow you to bridge your local machine with the cloud cluster for real-time local debugging.
What is automated root cause analysis (RCA)?
It is the use of AI to automatically correlate events and logs to identify the primary reason for a system failure or performance issue.
How do admission controllers prevent debugging issues?
They enforce security and configuration policies at the gate, preventing misconfigured resources from ever being deployed into the cluster environment and production.
Why is distributed tracing essential for serverless functions?
Tracing reveals "cold starts" and hidden delays in the execution path of serverless functions that traditional monitoring tools might miss entirely.
What is a "blameless culture" in DevOps?
It is an organizational culture that focuses on technical and process improvements after an incident rather than punishing individuals for human mistakes.
How does GitOps contribute to system stability?
GitOps uses Git as the single source of truth, ensuring that the live environment is always in sync with the version-controlled configuration manifests.
Can feature flags be used for debugging?
Yes, they allow you to disable failing features instantly in production, buying the team time to debug without requiring a full code rollback.
What is the benefit of using OpenTelemetry?
It provides a vendor-neutral, standardized way to collect and export logs, metrics, and traces across different languages, frameworks, and cloud providers.
How do knowledge graphs assist in incident response?
They map out the dependencies and relationships between all entities in your system, helping RCA tools quickly identify how a failure cascaded.
What is "zero-code auto-instrumentation"?
It is a feature of tools that automatically collect telemetry data from running applications without requiring developers to manually add tracking code or libraries.
What is the first step in effective cloud debugging?
The first step is always to clearly define the problem statement and gather all relevant logs and metrics to build an accurate timeline.
What's Your Reaction?
 Like
0
Like
0
 Dislike
0
Dislike
0
 Love
0
Love
0
 Funny
0
Funny
0
 Angry
0
Angry
0
 Sad
0
Sad
0
 Wow
0
Wow
0
![100+ Azure DevOps Interview Questions and Answers [Updated 2025]](https://www.devopstraininginstitute.com/blog/uploads/images/202509/image_140x98_68c40aa9a3834.jpg)


![Future Scope of DevOps Careers in Pune [Updated 2025]](https://www.devopstraininginstitute.com/blog/uploads/images/202510/image_140x98_68e3a84652312.jpg)


