


![Kong Interview Preparation Guide [2025]](https://www.devopstraininginstitute.com/blog/uploads/images/202509/image_430x256_68dbb95326997.jpg)


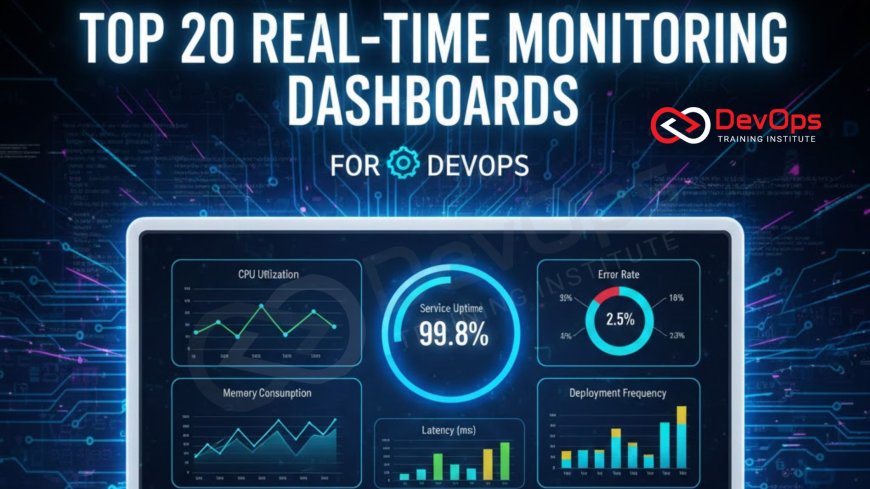
Top 20 Real-Time Monitoring Dashboards for DevOps
Discover the top 20 real-time monitoring dashboards for DevOps in 2025 designed to enhance system visibility and operational efficiency. This detailed guide covers essential tools for tracking metrics, logs, and traces, ensuring your team can maintain high performance and reliability. Learn how modern observability platforms empower engineers to identify bottlenecks quickly, automate incident response, and streamline workflows for better software delivery across diverse cloud environments today.
Introduction to DevOps Monitoring Dashboards
In the modern era of rapid software delivery, maintaining high availability and peak performance is a constant challenge for engineering teams. Real-time monitoring dashboards have become the central nervous system of the DevOps lifecycle, providing immediate visibility into complex, distributed environments. These visual interfaces aggregate vast amounts of telemetry data, converting raw numbers into actionable insights that allow teams to stay ahead of potential failures. By centralizing metrics, logs, and traces, these dashboards empower engineers to make data-driven decisions during critical moments of deployment and operation.
As organizations move toward microservices and cloud-native architectures, the sheer volume of data can become overwhelming without the right visualization tools. A well-designed dashboard doesn't just show data; it tells a story about system health and user experience. Whether you are tracking deployment frequency or monitoring server CPU usage, the right tool ensures that every member of the team has a clear view of the production landscape. This guide explores the most effective solutions available today, helping you choose the right platform to maintain a competitive edge in software reliability and performance.
The Importance of Real-Time Visibility
Real-time visibility is the cornerstone of proactive system management in a DevOps culture. Without it, teams are often forced into a reactive mode, only responding to issues after they have impacted the end-user. High-quality dashboards provide a "single source of truth" that bridges the gap between development and operations. When everyone looks at the same real-time data, communication improves, and the time required to identify the root cause of an incident drops significantly. This immediacy is vital for maintaining the strict service level agreements that modern businesses demand from their digital products.
Beyond simple troubleshooting, real-time monitoring supports the continuous improvement of the software delivery pipeline. By observing how new code impacts system resources in real-time, developers can refine their work and optimize performance on the fly. This level of insight is also essential for security, as it allows for the instant detection of anomalous behavior that might indicate a breach or a misconfiguration. Ultimately, investing in robust monitoring dashboards is an investment in the stability and longevity of your entire technological infrastructure, ensuring that growth does not come at the cost of reliability.
Essential Categories of Monitoring Tools
To build a comprehensive monitoring strategy, it is helpful to categorize tools based on their primary focus and data collection methods. Some platforms excel at infrastructure monitoring, tracking the health of physical or virtual servers, networks, and storage. Others focus on Application Performance Monitoring (APM), providing code-level visibility into how applications are executing and where latency is occurring. Understanding these distinctions helps teams avoid tool sprawl while ensuring that no part of the technology stack remains a "black box" during production hours.
Another critical category is log management and analysis, which involves collecting and searching through text-based records generated by systems and applications. This is often paired with user experience monitoring, which tracks how actual customers interact with the interface. By combining these different perspectives into a unified dashboarding strategy, DevOps teams can achieve full-stack observability. This holistic view is necessary for navigating the complexities of modern software environments, where a single failure in a minor microservice can have cascading effects across the entire platform.
Open Source vs Commercial Dashboards
Choosing between open-source and commercial monitoring solutions is a pivotal decision for any DevOps team. Open-source tools like Prometheus and Grafana offer unparalleled flexibility and are often the de-facto standard for Kubernetes environments. They allow for deep customization and have large communities that provide a wealth of pre-built dashboard templates. However, they often require significant manual effort to set up, maintain, and scale, which can be a hidden cost for smaller teams with limited operational bandwidth.
On the other hand, commercial platforms like Datadog and New Relic offer a "as-a-service" model that minimizes setup time and provides advanced features like AI-powered anomaly detection out of the box. These tools often come with high-quality support and seamless integrations across hundreds of different technologies. While the licensing costs can be substantial as data volume grows, many organizations find the reduced "toil" and faster time-to-value to be worth the investment. The right choice depends on your team's specific technical expertise, budget constraints, and the complexity of the systems being monitored.
Table: Top 20 Monitoring Dashboards Overview
| Dashboard Tool | Primary Use Case | Deployment Model | Key Strength |
|---|---|---|---|
| Grafana | General Visualization | Open Source / SaaS | Highly customizable dashboards. |
| Datadog | Full-Stack Observability | SaaS | 500+ built-in integrations. |
| Prometheus | Container Monitoring | Open Source | Native Kubernetes support. |
| New Relic | APM and Insights | SaaS | Developer-friendly interface. |
| Dynatrace | AI-Driven Monitoring | SaaS / Managed | Automated root cause analysis. |
| Splunk | Log & Security Analytics | Cloud / On-prem | Exceptional big data processing. |
| Kibana (ELK) | Log Visualization | Open Source / SaaS | Deep integration with Elasticsearch. |
| Zabbix | Infrastructure Monitoring | Open Source | Highly scalable for devices. |
| Nagios XI | Network & Server Health | On-prem / Cloud | Proven, reliable monitoring logic. |
| AppDynamics | Business Performance | SaaS / Managed | Tracks technical-business impact. |
| Netdata | Edge Monitoring | Open Source | Per-second metric granularity. |
| AWS CloudWatch | Cloud Native Monitoring | Cloud (AWS) | Deepest integration with AWS. |
| Sumo Logic | Log & Metric Management | SaaS | Strong security analytics. |
| Sensu | Event-Driven Monitoring | Open Source / SaaS | Automated workflow triggers. |
| Sematext | Full-Stack Search | SaaS | Excellent for log-metric correlation. |
| Librato | Time-Series Data | SaaS | Fast, easy metric aggregation. |
| InfluxDB | Time-Series Database | Open Source / Cloud | Optimized for IoT and high-load. |
| Sentry | Error Tracking | Open Source / SaaS | Real-time code exception monitoring. |
| Middleware | AI Cloud Monitoring | SaaS | Modern, clean AI-first approach. |
| PagerDuty | Incident Management | SaaS | Industry-leading alert orchestration. |
Leading Open Source Visualization Tools
Grafana remains the undisputed king of visualization in the DevOps world, providing a flexible platform that can connect to almost any data source. It allows users to build intricate dashboards that combine metrics from Prometheus, logs from Loki, and traces from Tempo into a single view. This "three pillars of observability" approach makes it easier to correlate different types of data, which is essential when debugging complex issues. The open-source nature of Grafana has fostered a massive library of community-shared dashboards, allowing new users to get started with professional-grade visualizations in minutes.
Prometheus, often paired with Grafana, is the go-to metric collection system for cloud-native applications. Its pull-based architecture and powerful PromQL query language make it exceptionally good at monitoring ephemeral resources like Kubernetes pods. By using labels to organize data, Prometheus allows for high-dimensional analysis, meaning you can easily slice and dice metrics by service name, environment, or version. For teams looking for a low-latency, real-time view of their infrastructure without the heavy overhead of commercial agents, this combination is often the most cost-effective and powerful solution available. Understanding observability in this context is key to success.
Advanced Enterprise Observability Platforms
Datadog has solidified its position as a leader in the commercial monitoring space by offering a truly unified platform for metrics, logs, and application performance. Its ability to ingest data from over 500 different technologies through a single agent simplifies the deployment process for large enterprises. The platform’s advanced features, such as Watchdog for AI-driven anomaly detection and Service Map for visualizing microservice dependencies, provide a level of automated insight that is difficult to replicate with manual tools. This makes it an ideal choice for teams managing large-scale, multi-cloud environments where speed and automation are paramount.
New Relic is another heavyweight that has successfully transitioned from a pure APM tool to a comprehensive observability platform. It is particularly well-regarded for its developer-centric approach, providing deep visibility into the performance of code across various languages and frameworks. New Relic’s NRQL query language allows for complex data analysis, and its "Explorer" view offers a clear, high-level summary of system health. For organizations that prioritize a smooth developer experience and want to integrate performance data directly into their CI/CD pipelines, New Relic offers a powerful set of features that can accelerate the delivery of high-quality software. These enterprise tools often support modern practices like platform engineering.
Specialized Log and Security Dashboards
The ELK stack, consisting of Elasticsearch, Logstash, and Kibana, is the gold standard for log management and visualization. Elasticsearch provides a powerful search engine capable of handling massive volumes of text data, while Kibana offers a rich set of visualization tools to build dashboards specifically for log events. This combination is essential for root cause analysis, as it allows engineers to search through millions of log lines in seconds to find the exact moment an error occurred. Many organizations also leverage the ELK stack for security monitoring, using it to detect unauthorized access attempts or suspicious patterns in network traffic.
Splunk is a more specialized commercial alternative that excels in complex, highly regulated industries. It provides unparalleled scalability and a suite of advanced security and compliance features that make it a favorite among large financial institutions and government agencies. Splunk’s "Search Processing Language" (SPL) is incredibly flexible, allowing users to extract insights from almost any type of machine data. While it can be more expensive than open-source alternatives, the depth of its analytical capabilities and its ability to handle extremely diverse data sets make it an indispensable tool for organizations with sophisticated monitoring and security requirements. Efficient data ingestion is a core part of automation in these ecosystems.
Key Features to Look for in a Dashboard
- Real-Time Data Refresh: The ability to update charts and graphs every few seconds is critical for identifying issues as they happen.
- Multi-Source Integration: A good dashboard should pull data from cloud providers, databases, and application code simultaneously.
- Anomaly Detection: Automated alerts based on machine learning can highlight problems that manual thresholds might miss.
- Drill-Down Capabilities: Engineers must be able to click on a high-level graph to see the underlying logs or traces for faster debugging.
- Customization and Sharing: Teams need to create views tailored to specific projects and share them easily with stakeholders.
When evaluating these features, consider the long-term scalability of the platform. A dashboard that works for five servers might become unreadable when you scale to five hundred. Look for tools that offer automated grouping, filtering, and "search-first" interfaces. Additionally, consider how well the tool integrates with your existing communication channels, such as Slack or PagerDuty. The ultimate goal is to create an environment where the dashboard acts as a proactive partner in maintaining system reliability, not just a passive display of historical data. Robust dashboards help teams manage risk during canary releases.
Best Practices for Dashboard Design
Designing an effective DevOps dashboard is an art that requires balancing detail with clarity. One of the most common mistakes is "dashboard bloat," where too many metrics are crammed into a single screen, making it impossible to spot actual trends. Instead, teams should follow the principle of "progressive disclosure," starting with high-level health indicators (like error rates and latency) and allowing users to drill down into specifics only when needed. Using a consistent color palette (such as green for healthy and red for critical) helps the eye navigate the data quickly during high-stress incidents.
Another best practice is to align dashboards with specific business or technical objectives. For instance, a "DORA Metrics" dashboard should focus purely on deployment frequency, lead time for changes, change failure rate, and time to restore service. Meanwhile, an infrastructure dashboard should prioritize CPU, memory, and disk health. By creating specialized views for different roles—such as developers, SREs, and product managers—you ensure that everyone has the specific information they need without unnecessary distractions. Regularly reviewing and refining these dashboards based on post-mortem findings will keep them relevant and useful as your systems evolve. This focus on efficiency is a core part of FinOps strategies.
Conclusion
Selecting the right real-time monitoring dashboard is more than just a technical choice; it is a strategic decision that shapes the efficiency and reliability of your entire DevOps operation. Whether you opt for the customizable power of open-source tools like Grafana and Prometheus or the comprehensive, AI-driven insights of commercial platforms like Datadog, the goal remains the same: total visibility. In an era where downtime can cost thousands of dollars per minute, the ability to detect and resolve issues in real-time is an essential competitive advantage. By following best practices for dashboard design and selecting tools that scale with your growth, you empower your engineering team to deliver better software faster and with greater confidence. As the landscape continues to evolve, staying updated on the latest observability trends will ensure that your monitoring strategy remains a pillar of your organizational success. Proactive monitoring is an essential component of a successful DevSecOps implementation, ensuring security and stability are maintained throughout the lifecycle. Using tools for resilience testing also helps strengthen these systems.
Frequently Asked Questions
What is a DevOps monitoring dashboard?
A DevOps monitoring dashboard is a visual interface that displays real-time data about system health, application performance, and development pipeline metrics.
Why is real-time data important for DevOps?
Real-time data allows teams to detect and resolve incidents instantly, minimizing downtime and ensuring a consistent experience for the end-users.
What are the three pillars of observability?
The three pillars are metrics, logs, and traces, which together provide a complete view of how a system is functioning internally.
Is Grafana free to use?
Yes, Grafana has a powerful open-source version that is free, though they also offer a managed Cloud version for a fee.
Can I monitor cloud and on-prem systems together?
Most modern tools like Datadog and Zabbix support hybrid environments, allowing you to see all your infrastructure in one single dashboard.
What are DORA metrics?
DORA metrics are four key indicators—deployment frequency, lead time, change failure rate, and MTTR—used to measure DevOps team performance effectively.
How do AI-powered dashboards work?
They use machine learning to establish performance baselines and automatically flag any data patterns that deviate significantly from the normal system behavior.
What is the difference between a metric and a log?
A metric is a numerical measurement over time, while a log is a text-based record of a specific event occurring in a system.
Which tool is best for Kubernetes monitoring?
Prometheus and Grafana are widely considered the standard for Kubernetes due to their native integration and highly efficient handling of container data.
How many metrics should be on one dashboard?
It is best to limit dashboards to 7-10 high-level charts to avoid information overload and ensure quick scannability during critical incidents.
What is distributed tracing?
Distributed tracing tracks a single request as it moves through multiple microservices, helping engineers identify exactly where latency or errors are occurring.
Are commercial tools worth the cost?
For many teams, the reduced maintenance and advanced out-of-the-box features of commercial tools justify the expense compared to managing open-source stacks.
Can dashboards help with security?
Yes, security dashboards track access logs and anomalous traffic patterns, helping DevSecOps teams identify potential threats and vulnerabilities in real-time.
How often should dashboards be updated?
Dashboards should be reviewed after major incidents or system changes to ensure they are still tracking the most relevant and helpful metrics.
What is MTTR in monitoring?
MTTR stands for Mean Time To Recovery, a critical metric that measures how long it takes to restore service after a failure.
What's Your Reaction?
 Like
0
Like
0
 Dislike
0
Dislike
0
 Love
0
Love
0
 Funny
0
Funny
0
 Angry
0
Angry
0
 Sad
0
Sad
0
 Wow
0
Wow
0


![100+ Azure DevOps Interview Questions and Answers [Updated 2025]](https://www.devopstraininginstitute.com/blog/uploads/images/202509/image_140x98_68c40aa9a3834.jpg)


![Future Scope of DevOps Careers in Pune [Updated 2025]](https://www.devopstraininginstitute.com/blog/uploads/images/202510/image_140x98_68e3a84652312.jpg)


