10 Application Performance Tools DevOps Teams Use
Optimize your software's speed and reliability in 2026 by exploring the ten essential application performance monitoring (APM) tools used by elite DevOps teams. This expert guide provides a deep dive into full-stack observability, distributed tracing, and AI-driven performance insights using industry-leading platforms like Datadog, New Relic, and Dynatrace. Learn how to identify bottlenecks, reduce latency, and improve user experience through real-time telemetry and automated troubleshooting. Whether you are managing global microservices or high-traffic web apps, these proven tools will empower your engineering team to maintain peak performance and technical excellence in today's demanding digital landscape.
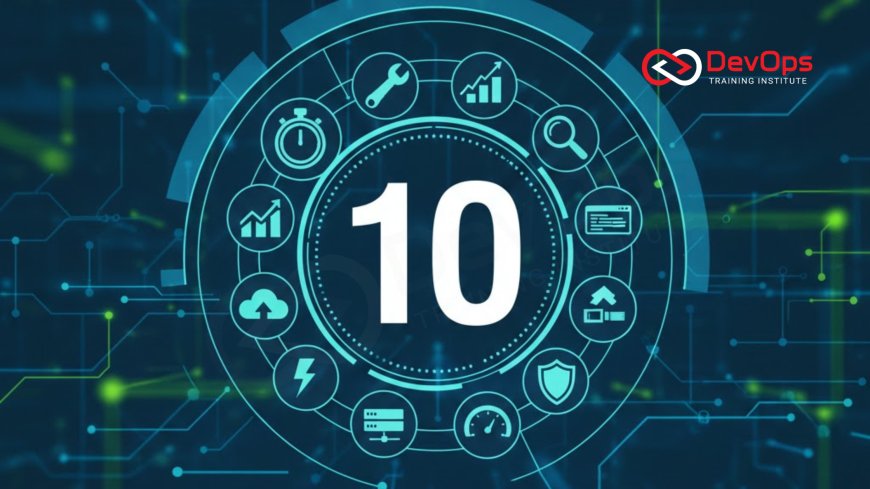
Introduction to Modern Application Performance Monitoring
In the digital economy of 2026, application performance is synonymous with business success. A delay of even a few hundred milliseconds can lead to decreased user engagement, lost revenue, and damage to brand reputation. As applications have transitioned from monoliths to complex, distributed microservices, traditional monitoring is no longer sufficient. DevOps teams now require specialized Application Performance Monitoring (APM) tools that provide deep visibility into the code level, database queries, and third-party API dependencies. These tools are the "X-ray machines" of the technical world, allowing engineers to see exactly where a system is slowing down.
Modern APM goes beyond simple "up or down" checks; it focuses on observability—the ability to understand the internal state of a system by looking at the data it produces. By integrating these ten essential tools into their workflow, DevOps teams can move from reactive firefighting to proactive performance optimization. This shift is a critical component of technical excellence, ensuring that every deployment is measured against its impact on the end-user experience. This guide explores the most powerful instruments available today to help your team maintain a fast, resilient, and high-performing digital infrastructure.
Datadog: The Unified Observability Powerhouse
Datadog has established itself as a leader in the APM space by offering a unified platform that correlates infrastructure metrics, application traces, and log data. Its primary strength lies in its ability to provide a "single pane of glass" view across the entire stack. With its Watchdog AI, Datadog can automatically identify performance anomalies and surface the root cause of a bottleneck before it impacts a significant number of users. This predictive capability is a major driver of system reliability in complex cloud-native environments.
The platform’s distributed tracing capabilities allow engineers to follow a single request as it travels through various microservices, identifying exactly which component is introducing latency. By utilizing continuous verification, Datadog ensures that your cluster states remain healthy and that performance goals are met during every rollout. It is an essential tool for high-growth organizations that need to scale their monitoring alongside their infrastructure without losing the granular detail required for effective debugging and performance tuning.
New Relic: Data-Driven Performance Engineering
New Relic is a pioneer in the APM industry, known for its deep code-level visibility and user-centric monitoring. Its New Relic Explorer provides an intuitive way to visualize the relationships between different services, making it easier to spot cascading failures in a distributed system. The platform excels at Real User Monitoring (RUM), capturing actual user sessions to show how real people are experiencing your application across different devices and geographies. This data is invaluable for prioritizing performance fixes that will have the highest impact on customer satisfaction.
New Relic also offers a powerful query language (NRQL) that allows teams to build custom dashboards and alerts tailored to their specific business KPIs. This flexibility ensures that the monitoring strategy is aligned with the organization's unique technical and commercial goals. By integrating who drives cultural change strategies, engineering leaders can use New Relic's transparent data to foster a performance-first mindset across the entire development team, leading to more robust and optimized software releases.
Dynatrace: The Autonomous AI-Driven APM
Dynatrace distinguishes itself through its "Davis" AI engine, which provides autonomous root cause analysis and impact assessment. Unlike tools that require manual configuration of alerts and thresholds, Dynatrace is designed to discover your entire environment automatically and establish its own performance baselines. When an issue occurs, Davis identifies the exact problem and its business impact, allowing the team to focus on the fix rather than the investigation. This level of automation is a cornerstone of AIOps in 2026.
The platform’s OneAgent technology simplifies the deployment of monitoring by automatically injecting sensors into every container and process in your cluster. This ensure 100% visibility without the manual overhead of instrumenting every service individually. By utilizing architecture patterns that support automation, Dynatrace turns performance monitoring into a self-managing service. It is particularly well-suited for large enterprises managing massive, dynamic Kubernetes environments where manual monitoring simply cannot keep up with the rate of change.
Comparison of Top 10 APM Tools
| Tool Name | Core Strength | Primary Benefit | Best For |
|---|---|---|---|
| Datadog | Unified Platform | Full-stack correlation | Scaling Startups |
| New Relic | Real-User Data | End-to-end visibility | Customer-centric Apps |
| Dynatrace | Autonomous AI | No-config Root Cause | Large Enterprises |
| AppDynamics | Business Context | Revenue-impact links | Financial Services |
| Honeycomb | High Cardinality | Debugging "unkn-unkn" | SRE Teams |
Honeycomb: Mastery of High-Cardinality Data
Honeycomb is a specialized tool built for the modern SRE who needs to investigate "unknown unknowns." Unlike traditional APM tools that aggregate data into metrics, Honeycomb preserves the full context of every event, allowing you to slice and dice your data by any dimension—user ID, container ID, or even specific feature flags. This is critical for identifying issues that only affect a tiny subset of your users, which are often the hardest to find and fix. It represents the pinnacle of modern observability.
The platform’s BubbleUp feature automatically highlights the differences between "fast" and "slow" requests, instantly showing you which attributes (like a specific browser version or a database shard) are correlated with poor performance. By utilizing GitOps to manage your instrumentation configurations, you ensure that your observability is as version-controlled as your code. Honeycomb empowers teams to move away from "looking at dashboards" and toward "interrogating their data," leading to a much deeper understanding of system behavior and faster incident resolution.
AppDynamics: Linking Performance to Business Value
AppDynamics (part of Cisco) is designed for organizations that need to understand how technical performance impacts their bottom line. It features Business Transaction Monitoring, which maps technical requests to specific business outcomes like "checkout success" or "account creation." If a database query slows down, AppDynamics can show you exactly how much potential revenue is at risk. This context is vital for bridge-building between engineering and business leadership, ensuring that everyone is aligned on technical priorities.
The platform also includes Cisco Full-Stack Observability, which extends visibility into the network and security layers. This comprehensive approach helps teams identify issues that might be occurring outside of the application code, such as an ISP bottleneck or a firewall misconfiguration. By utilizing admission controllers to ensure every service is deployed with the correct monitoring tags, you can ensure that your business transactions are always tracked. AppDynamics provides the strategic insights needed to turn technical performance into a measurable competitive advantage for the enterprise.
Instana: Automated APM for Microservices
Instana (an IBM company) is a "hands-off" APM solution specifically built for the era of microservices and containers. It features a Dynamic Graph that continuously maps the dependencies between all your services, containers, and infrastructure components in real-time. Whenever you deploy a new container or a Kubernetes service, Instana detects it and begins monitoring it immediately without any manual setup. This "auto-discovery" is a game-changer for teams running highly dynamic and elastic workloads.
Instana’s "1-second granularity" provides the highest fidelity monitoring available, ensuring that even the briefest performance spikes are captured and analyzed. This is essential for debugging transient issues that might be missed by tools with longer sampling intervals. By utilizing containerd for efficient runtime management, you can ensure your services start fast while Instana ensures they stay fast. Instana provides the automated, high-definition visibility needed to manage the complexity of modern orchestration at scale with total confidence.
Best Practices for APM Implementation
- Set Performance Baselines: Establish "normal" metrics early so you can quickly identify deviations during high-traffic events or new releases.
- Use Distributed Tracing: In a microservices world, tracing is mandatory for understanding the journey of a request across service boundaries.
- Monitor the End User: Don't just look at server-side metrics; use Real User Monitoring (RUM) to see how actual people experience your app.
- Secure Your Data: Use secret scanning tools to ensure no sensitive PII or credentials are accidentally leaked into your APM traces or logs.
- Integrate with CI/CD: Automatically tag your performance data with release versions to see the immediate impact of new code on system speed.
- Prioritize Business Transactions: Focus your optimization efforts on the "critical paths" that directly affect revenue or user sign-ups.
- Alert on Symptoms, Not Causes: Set alerts for "latency is high" or "error rate is up" rather than "CPU is at 80%" to reduce alert fatigue.
Success in performance monitoring is an iterative process that requires a commitment to both technical tools and operational discipline. As your team becomes more comfortable with these tools, you will find that you spend less time guessing and more time fixing. By staying informed about AI augmented devops trends, you can ensure that your monitoring strategy remains modern and efficient. The goal is to create a culture where performance is not an afterthought but a core feature of the product. By prioritizing these ten tools today, you are building a resilient and high-performing technical future for your entire organization.
Conclusion: Choosing the Right Tool for Your Team
In conclusion, the ten application performance tools discussed in this guide provide a comprehensive suite of options for any modern DevOps team. Whether you need the unified power of Datadog, the autonomous AI of Dynatrace, or the high-cardinality debugging of Honeycomb, there is a tool designed to meet your specific technical challenges. The key is to choose the instrument that aligns best with your architecture and your team's workflow. By prioritizing observability and performance, you empower your developers to ship faster and more reliably while ensuring a world-class experience for your users.
As you move forward, remember that release strategies that incorporate performance verification are the hallmark of high-performing teams. Transitioning to a data-driven monitoring model is a journey that pays dividends in terms of system stability and customer trust. By utilizing ChatOps techniques, you can bring these performance insights directly into your team's daily conversation, fostering collaboration and rapid problem-solving. Embrace these ten tools today to transform your application performance into a powerful engine for innovation and global business growth.
Frequently Asked Questions
What is the primary difference between APM and traditional monitoring?
Traditional monitoring tells you if a server is up; APM tells you why an application is slow by looking at code-level performance and traces.
How does distributed tracing work in microservices?
It assigns a unique ID to a request, allowing it to be tracked across multiple services and network hops to identify specific latency bottlenecks.
Why is "High Cardinality" important in performance debugging?
High cardinality allows you to group data by unique values like User ID or Session ID, which is essential for finding bugs that only affect specific users.
Can I use multiple APM tools simultaneously?
While possible, it is generally recommended to standardize on one "primary" observability platform to ensure data correlation and reduce agent overhead on your servers.
What is "Real User Monitoring" (RUM) and why should I use it?
RUM captures actual user sessions from browsers or apps, providing the most accurate view of how performance varies across different locations and devices.
Does adding an APM agent slow down my application?
Most modern agents have very low overhead (typically 1-3%), but it is important to test performance in a staging environment before a full rollout.
What role does AI play in modern performance tools?
AI is used for automated anomaly detection, root cause analysis, and predictive scaling, helping teams find and fix issues faster than manual investigation.
How do I integrate APM with my CI/CD pipeline?
You can use deployment markers or API calls to notify your APM tool of new releases, allowing you to correlate code changes with performance shifts instantly.
What is a "Business Transaction" in AppDynamics?
It is a specific user journey—like "Add to Cart"—that is tracked across all technical layers to show the business impact of any performance issues.
Is there a free, open-source alternative to these paid APM tools?
Yes, tools like Prometheus (for metrics) and Jaeger (for tracing) provide powerful open-source alternatives, though they often require more manual setup and management.
How does Honeycomb's "BubbleUp" feature work?
It automatically compares a selected set of "bad" events against "good" ones to show which attributes are uniquely present in the failing requests.
What are "unknown unknowns" in an SRE context?
They are system failures that you couldn't have predicted or set an alert for, requiring deep, exploratory observability to identify and understand.
How does Instana's Dynamic Graph help with microservices?
It maintains a real-time map of all service dependencies, ensuring that you always understand the "context" of a failure in a complex environment.
Should I monitor my third-party APIs with APM?
Yes, many APM tools can track the latency and error rates of external calls, helping you prove when an issue is caused by a provider rather than your code.
What is the first step in implementing a performance strategy?
Start by identifying your most critical user paths and instrumenting those first to ensure you are protecting the most valuable parts of your application.
What's Your Reaction?
 Like
0
 Dislike
0
 Love
0
 Funny
0
 Angry
0
 Sad
0
Sad
0
 Wow
0
Wow
0


![Kong Interview Preparation Guide [2025]](https://www.devopstraininginstitute.com/blog/uploads/images/202509/image_430x256_68dbb95326997.jpg)


![100+ Azure DevOps Interview Questions and Answers [Updated 2025]](https://www.devopstraininginstitute.com/blog/uploads/images/202509/image_140x98_68c40aa9a3834.jpg)


![90+ Git and GitHub Interview Questions [2025]](https://www.devopstraininginstitute.com/blog/uploads/images/202509/image_140x98_68c40a7931d60.jpg)


![Future Scope of DevOps Careers in Pune [Updated 2025]](https://www.devopstraininginstitute.com/blog/uploads/images/202510/image_140x98_68e3a84652312.jpg)


