


![Kong Interview Preparation Guide [2025]](https://www.devopstraininginstitute.com/blog/uploads/images/202509/image_430x256_68dbb95326997.jpg)


10 Real Benefits of Observability in DevOps
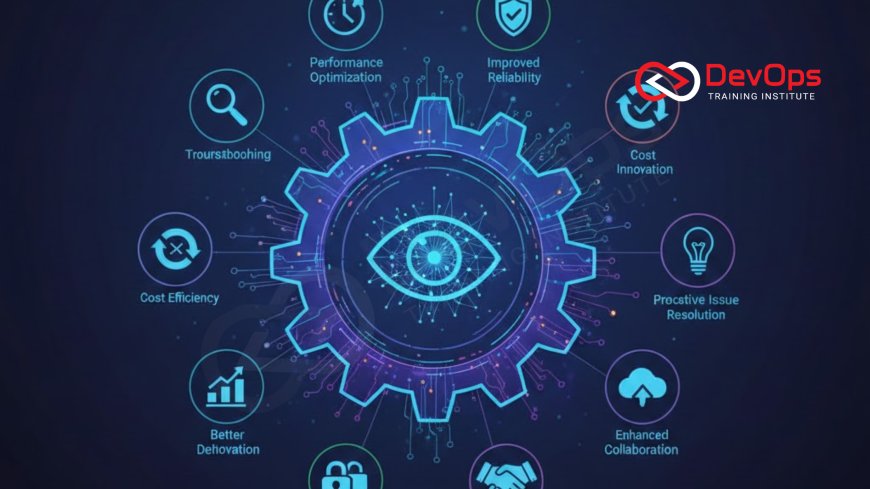
Understand the 10 profound benefits of implementing observability in your DevOps workflow, moving beyond simple health checks to achieve deep system insight. This guide details how observability drastically reduces Mean Time to Resolution (MTTR), enables proactive anomaly detection, and ensures true alignment with crucial Service Level Objectives (SLOs). Learn how correlated logs, metrics, and traces foster a non-punitive culture, improve capacity planning, and provide the essential context needed for managing complex cloud-native architectures, ultimately delivering a superior customer experience and sustained operational reliability at enterprise scale.
Introduction: Moving Beyond Monitoring
In the context of modern software delivery, particularly within complex, distributed, and cloud-native environments, the traditional practice of "monitoring" is no longer sufficient. Monitoring, which typically involves tracking known failure modes (e.g., CPU load, memory usage, fixed alerts), fails to provide meaningful answers when the system encounters a novel failure mode—the "unknown unknowns." This is where Observability emerges as a profound architectural principle. Observability is defined as the measure of how well internal states of a system can be inferred from its external outputs (logs, metrics, and traces). It is the capability to ask arbitrary, ad-hoc questions about the system without having to deploy new code or specific instrumentation to investigate. For DevOps teams, this transition from reactive monitoring to proactive observability is the single most critical step toward achieving true operational excellence and resilience, transforming troubleshooting from guesswork into data-driven investigation.
The implementation of observability is a strategic investment that fundamentally changes how development, operations, and security teams interact with the production environment. It shifts the operational paradigm from receiving alerts about what is broken to understanding the complex interdependencies and why a particular service is failing or slowing down. This deep, contextual insight is necessary because modern microservice architectures, driven by event-based communication and dynamic container orchestration, generate an exponentially higher number of interactions and potential failure points than monolithic applications. Without the ability to trace a single transaction across dozens of ephemeral services, operations teams are left effectively blind, leading to chaotic incident response and unsustainable operational toil. The 10 benefits outlined below demonstrate how observability translates directly into measurable improvements in reliability, security, and business value.
The Pillars of Observability
Observability is built upon three foundational pillars, often referred to as the telemetry data required to reconstruct the state of the system and understand its behavior. These pillars are not interchangeable; they must be collected, standardized, and correlated together to provide the necessary contextual depth for effective root cause analysis (RCA). Implementing this unified telemetry collection is the essential first step that enables all subsequent operational and cultural benefits that a mature DevOps practice can realize, transforming raw data into actionable intelligence for every team member.
The three core pillars that collectively enable observability are:
- Metrics: These are quantitative measurements collected over time, often aggregated time-series data such as CPU utilization, request rates, error counts, and latency percentiles. Metrics are highly efficient for tracking the high-level health and performance of the system and are essential for alerting teams when key performance indicators (KPIs) cross defined thresholds.
- Logs: These are discrete, timestamped records of events that occurred within the application or infrastructure, recording specific state changes or actions. Logs are vital for providing the granular, human-readable context necessary to understand exactly what happened at a specific point in time, and are essential during security auditing and forensic investigation, provided they are structured and centralized.
- Traces: Distributed tracing tracks the complete journey of a single user request as it traverses multiple services in a distributed application architecture. Traces provide a visual map of the request's path, showing the latency accumulated at each service boundary and revealing complex dependencies or bottlenecks that metrics alone cannot identify, making them crucial for performance optimization in microservices.
Integrating these three data types ensures that an engineer can move seamlessly from a high-level alert (Metrics) to identifying the affected service (Traces) and ultimately to the exact line of code or configuration error that caused the failure (Logs). This ability to correlate disparate data points across the entire technology stack is what truly distinguishes observability from basic, fragmented monitoring tools, guaranteeing that incident response is fast, accurate, and ultimately proactive, fostering a state of continuous operational learning.
Accelerating Incident Response and Analysis
The most immediate and financially measurable benefits of implementing observability are related to incident response. Complex cloud outages often cost organizations hundreds of thousands of dollars per hour, making the speed of diagnosis the primary factor in minimizing business impact. Observability tools directly address this problem by replacing fragmented, manual data gathering during an incident with instant, correlated visualization, cutting down the time spent determining where the failure occurred and allowing engineers to immediately focus on why it happened.
Reduced Mean Time to Resolution (MTTR): Observability dramatically shrinks the time required to diagnose and fix a problem by providing immediate context. Instead of forcing engineers to manually hop between log servers, monitoring dashboards, and tracing systems, a unified observability platform automatically correlates the alert, the relevant metrics, and the full trace of the failed request. This instant correlation eliminates the painful "War Room" scramble for data, often reducing MTTR from hours to minutes, which directly minimizes the financial impact of service outages and ensures adherence to core reliability targets.
Faster Root Cause Analysis (RCA): Traditional monitoring systems typically indicate symptoms (e.g., high error rate) but rarely the root cause. Observability, through distributed tracing, allows engineers to follow the exact path of a failed transaction, identifying precisely which service, database call, or network hop introduced latency or failed outright. Furthermore, the standardization of unstructured packets that form communication across services allows teams to understand traffic flow. Understanding how internal services communicate—such as the difference between connection-oriented and connection-less traffic—is crucial, making an awareness of TCP and UDP traffic a prerequisite for reliable tracing and RCA.
Proactive Prediction and Stability
Beyond merely reacting faster to failure, mature observability enables the organization to anticipate problems before they impact the customer. By continuously analyzing performance data and identifying deviations from baseline behavior, teams can move into a predictive operational model, taking corrective action during off-peak hours instead of facing sudden emergencies. This proactive approach is foundational to SRE practices and transforms the operations team from reactive firefighters into stability engineers, safeguarding customer experience and system resilience.
Proactive Anomaly Detection: Advanced observability platforms use machine learning (ML) algorithms to constantly analyze metrics and log patterns. These tools can automatically flag subtle, non-alerting deviations—such as a gradual increase in database connection timeouts or a slight, consistent rise in memory usage—long before they cross a static alerting threshold. By identifying these "anomalies," teams can address systemic weaknesses or resource exhaustion issues proactively, preventing the small, often ignored failures from snowballing into a catastrophic outage, ensuring service continuity and reliability.
Effective SLO/SLA Management: Observability is the technical mechanism required to enforce Service Level Objectives (SLOs) and Service Level Agreements (SLAs). SLOs are internal targets (e.g., 99.9% uptime for API calls), which are tracked via defined Service Level Indicators (SLIs) collected directly from the observability stack. By measuring these user-centric metrics in real-time, teams gain an objective view of service health and are immediately alerted when performance dips below the target, allowing for early intervention. This ensures that every engineering decision is guided by reliability, which often requires strict control over necessary communication channels and defined ports and protocols to meet performance objectives.
Core Benefits of Observability Table
The benefits of observability span technology, finance, security, and culture, demonstrating its comprehensive impact on the modern enterprise. Adopting this holistic approach allows organizations to address complexity head-on, turning the vast amounts of telemetry data generated by cloud infrastructure into tangible business advantages, driving efficiency and accountability across all departments involved in software delivery.
| # | Core Benefit | Technical Mechanism | Primary Business Impact |
|---|---|---|---|
| 1 | Reduced MTTR | Automated correlation of logs, metrics, and traces. | Minimized financial cost and reputational damage from outages. |
| 2 | Proactive Anomaly Detection | ML-powered analysis of baseline performance deviations. | Prevention of cascading failures and zero unplanned downtime. |
| 4 | Better Capacity Planning | Accurate, granular resource utilization data and performance baselines. | Significant reduction in cloud compute costs and optimized scaling. |
| 5 | Enhanced Customer Experience (CX) | Tracing request flow to eliminate user-facing latency and bottlenecks. | Improved customer satisfaction, reduced churn, and increased revenue. |
| 7 | Elimination of Blind Spots | Mandatory instrumentation of all code paths and third-party services. | Full service map visibility, no hidden dependencies, and complete system accountability. |
Business Value and Customer Focus
The impact of observability extends far beyond the engineering department, directly influencing the company's financial health, resource allocation, and relationship with its customers. By translating technical metrics into business outcomes, DevOps teams can proactively optimize infrastructure based on peak demand or high-value customer activity. The data provided ensures that every resource allocation decision is rooted in accurate usage patterns rather than conservative guesswork, driving strategic financial advantages and superior service delivery.
Better Capacity Planning and Cost Optimization: Observability provides precise, granular resource utilization data, far beyond basic cloud provider billing metrics. By analyzing long-term trends and comparing resource requests to actual usage patterns, engineering teams can accurately size container resource limits and scale deployments optimally. This minimizes resource waste (idle CPUs, unused memory), allowing for significant cloud cost savings (FinOps) while ensuring that the infrastructure remains scalable enough to meet peak demand reliably. Furthermore, sophisticated analysis of network traffic distribution is often required for optimization, especially when managing traffic distribution across availability zones and VPCs.
Enhanced Customer Experience (CX): The end goal of any DevOps workflow is to deliver value to the customer reliably and quickly. Observability achieves this by focusing on user-centric metrics (like end-to-end transaction latency) and using distributed tracing to eliminate hidden bottlenecks in the user journey. By pinpointing the exact microservice or database query causing a five-second lag on a checkout page, teams can prioritize performance improvements that directly correlate with user satisfaction, reducing shopping cart abandonment and increasing overall customer retention rates.
Security, Auditability, and Learning
In a cloud environment, logs and traces are not just troubleshooting tools; they are essential artifacts for security forensics and compliance auditing. Observability enhances security by providing a complete, historical record of every event, while culturally, it transforms incident response from a stressful punitive event into a systematic learning opportunity, crucial for long-term organizational maturity and retention of skilled engineers.
Stronger Security and Auditability: Observability ensures every interaction is logged, providing the necessary audit trail for compliance (e.g., GDPR, HIPAA) and security investigations. Distributed tracing can instantly identify requests that accessed unauthorized or sensitive internal services. Furthermore, by correlating authentication logs with API calls, teams can immediately detect anomalous user behavior or service account compromises, ensuring that robust network security policies are being enforced at runtime and allowing for rapid isolation of compromised components before major damage can occur.
Fosters a Blameless Culture / Learning: Incident response based on hard data (logs, metrics, traces) removes the need for guesswork and speculation, shifting the focus from "who is to blame" to "what caused the systemic failure." This is the core principle of a blameless post-mortem culture. Observability provides the factual evidence needed to conduct effective post-mortems, allowing teams to analyze the incident objectively, learn from the failure, and invest resources in fixing root causes—not just symptoms—driving continuous process improvement across development and operations teams.
Observability and Network Awareness
The effectiveness of an observability stack in a distributed cloud environment is fundamentally linked to the engineering team's understanding of networking principles. In complex environments, traces and metrics often stop at the boundary of a cloud service (e.g., a load balancer or a managed NAT gateway), requiring the engineer to understand how packets are routed in the abstracted network. The trace data itself relies on headers that uniquely identify a request as it crosses network boundaries, analogous to how unique identifier systems work in traditional networking.
Understanding concepts like Cloud Networking is crucial because the network layer is defined by code (Infrastructure as Code) rather than physical hardware. This difference means engineers must know how to trace traffic not just through application services, but also through virtual firewalls, routing tables, and VPC peering connections, which are all part of the application's true execution environment. Observability tools must be instrumented to collect data from these network layers (virtual NICs, load balancers, etc.), effectively allowing the team to visualize the traffic flow at both the application level and the underlying infrastructure level, which is a key distinction from monitoring.
Moreover, diagnosing complex communication failures between microservices requires knowing which protocols belong to which layer of the system. For instance, understanding that network policies operate at Layer 3 and Layer 4 of the OSI model allows an engineer to quickly determine whether a communication failure is caused by an application error (Layer 7) or a virtual firewall block (Layer 4). Observability tools provide the data, but the engineer needs the foundational knowledge of how protocols relate to the network topology to interpret trace data correctly, preventing misdiagnoses when troubleshooting distributed application performance problems.
Conclusion
Implementing observability is a necessary architectural shift that transforms a DevOps organization's ability to operate and evolve. The 10 real benefits detailed—ranging from the immediate financial gain of reduced MTTR and optimized capacity planning to the long-term strategic advantage of improved customer experience and a blameless culture—demonstrate that observability is the engine of sustainable software delivery at scale. By meticulously collecting, standardizing, and correlating the three pillars of telemetry, teams gain the essential context needed to ask arbitrary questions about novel failures, eliminating monitoring blind spots and ensuring comprehensive system accountability.
Ultimately, observability elevates the engineering practice, allowing teams to proactively maintain performance, enforce reliability targets via SLOs, and securely manage complex cloud infrastructure. It provides the single, truthful source of operational data that drives continuous improvement, transforming incident response from a chaotic scramble into a precise, data-driven learning opportunity that secures the organization's financial health and its standing in the competitive digital marketplace.
Frequently Asked Questions
What are the three pillars of observability?
The three pillars are Metrics (aggregated time-series data), Logs (discrete event records), and Traces (end-to-end request flow tracking).
How does observability reduce MTTR?
It reduces MTTR by automatically correlating logs, metrics, and traces, giving engineers the immediate context needed to pinpoint the root cause without manual searching.
What is the difference between monitoring and observability?
Monitoring tells you if the system is working (known failures); observability lets you ask any question about why it's not working (unknown failures).
How does tracing help with performance?
Tracing visualizes the request path across microservices, pinpointing the specific component or network call responsible for adding latency.
What are SLOs and how does observability help?
SLOs are internal reliability targets (e.g., 99.9% uptime). Observability provides the real-time data needed to measure and enforce those targets accurately.
How does observability help with cloud cost?
It provides granular resource utilization data, allowing teams to accurately size instances, eliminate waste, and optimize cloud capacity planning.
Is observability required for monolith applications?
While most crucial for microservices, observability is beneficial for monoliths as it still improves RCA, performance tuning, and proactive anomaly detection.
How does tracing relate to network headers?
Tracing relies on injecting unique headers into requests that are passed across services, allowing the system to track the request's journey across network boundaries.
Why is a blameless culture enabled by observability?
It is enabled because observability provides objective, factual data about the failure, shifting the focus from individual error to systemic flaws.
What is proactive anomaly detection?
It is the use of ML to identify subtle deviations from normal system behavior before they cross fixed thresholds, allowing intervention before an outage occurs.
How does observability support security audits?
It supports audits by providing a complete, standardized, and historical log and trace record of all user and service interactions for forensic analysis.
How does observability enforce compliance in cloud networking?
It allows real-time checking of traffic flows against defined virtual firewall rules, ensuring that internal network security policies are being strictly maintained.
Why is Layer 3 and Layer 4 knowledge important for tracing?
Knowing Layer 3 and Layer 4 helps diagnose if traffic failed due to network routing (L3) or firewall/port issues (L4) versus an application error (L7).
What is the benefit of standardizing log data?
Standardizing logs (e.g., to JSON) makes them queryable and correlatable with metrics and traces, moving them beyond simple text files for troubleshooting.
Does observability eliminate the need for monitoring alerts?
No, observability augments monitoring; it improves the quality and actionability of alerts by ensuring they are tied to user-centric SLOs rather than just resource usage.
What's Your Reaction?
 Like
0
Like
0
 Dislike
0
Dislike
0
 Love
0
Love
0
 Funny
0
Funny
0
 Angry
0
Angry
0
 Sad
0
Sad
0
 Wow
0
Wow
0


![100+ Azure DevOps Interview Questions and Answers [Updated 2025]](https://www.devopstraininginstitute.com/blog/uploads/images/202509/image_140x98_68c40aa9a3834.jpg)


![Future Scope of DevOps Careers in Pune [Updated 2025]](https://www.devopstraininginstitute.com/blog/uploads/images/202510/image_140x98_68e3a84652312.jpg)


