






































Datadog Scenario-Based Interview Questions (2027)
38 Datadog scenario interview questions with answers: missing hosts, latency spikes, alert fatigue, Kubernetes, log and metric costs, incidents.
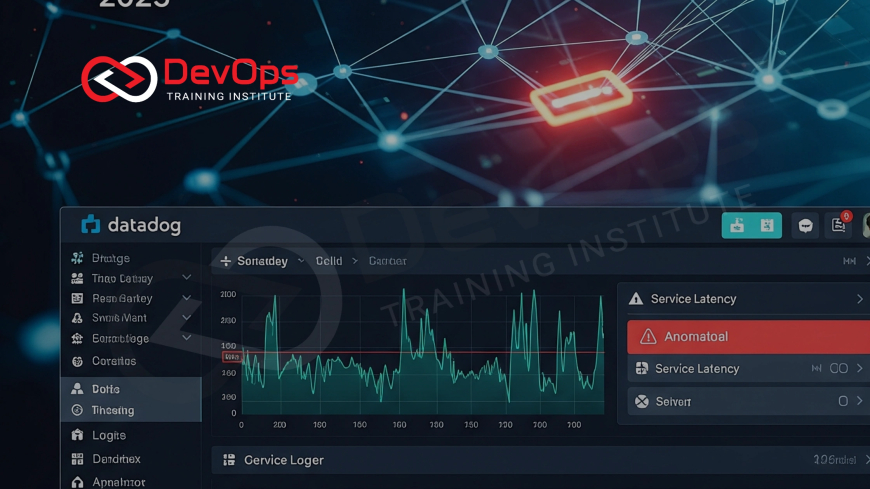
Datadog scenario-based interview questions describe a production problem, such as a noisy alert, a latency spike, a missing host or a log bill that doubled, and ask what you would check, in what order, and how you would stop it happening again. Interviewers score the reasoning: which Datadog view you open first, which evidence you trust, and how you fix the cause.
This page has 38 scenarios with model answers, grouped by experience level and followed by four end-to-end incident walk-throughs. If you need the definitions first (Agent, tags, monitors, APM), start with our Datadog engineer interview questions, which is the core question bank for this topic. For architecture-level design questions, use the advanced Datadog interview guide. This page stays on troubleshooting: what you do when something is already wrong.
Key takeaways
- Answer every scenario in the same order: confirm the symptom, scope the impact, find the cause, fix it, then prevent a repeat.
- Most "missing data" scenarios come down to the Agent: its status output, its API key, its network path to Datadog, or a broken integration config.
- Unified service tagging (
env,service,version) is what lets you pivot between metrics, traces and logs. Many scenario answers depend on it. - Cost scenarios (custom metrics, log indexing, APM ingestion) are now common. Know what drives each bill and which control reduces it.
- Alert fatigue questions are about monitor design: thresholds, evaluation windows, recovery thresholds, composite monitors and SLO burn-rate alerts.
- Senior candidates are expected to talk about ownership, runbooks and the post-incident review, not only the Datadog clicks.
How to answer a Datadog scenario question
Interviewers who ask scenarios want to hear a method. A five-step frame works for almost every question on this page:
| Step | What you say | Datadog place to look |
|---|---|---|
| 1. Confirm | Is the symptom real, or is the monitoring wrong? | Monitor status and history, Agent status, Metrics Explorer |
| 2. Scope | Which services, hosts, regions and users are affected? | Service Catalog, Infrastructure List, tags |
| 3. Cause | What changed, and what does the evidence point to? | APM traces, Log Explorer, Events, deployment tracking by version |
| 4. Fix | The smallest safe action that restores service | Rollback, scale out, config fix; watch the dashboard recover |
| 5. Prevent | Monitor, test or guardrail that catches it earlier next time | New or tuned monitor, SLO, Synthetic test, runbook link |
Saying "first I would confirm the data is trustworthy" in the first ten seconds shows the interviewer you have handled real incidents. For a wider view of how Datadog compares with other tools, see our guide to observability tools for DevOps monitoring.
Freshers and junior engineers: scenarios 1 to 10
These scenarios test whether you can operate the Agent, read a dashboard and avoid basic mistakes.
1. A new Linux host does not appear in the Infrastructure List. What do you check?
Run sudo datadog-agent status on the host and read the output top to bottom. It shows whether the Agent is running, whether the API key is valid, which site it reports to, and whether the forwarder is sending data.
- Confirm the service is running (
systemctl status datadog-agent). - Check
api_keyandsitein/etc/datadog-agent/datadog.yaml. A key from one Datadog site (for example US1) does not work against another site (for example EU1). - Check outbound HTTPS (port 443) to the Datadog intake, or the proxy settings if the host has no direct internet access.
- Read
/var/log/datadog/agent.logfor errors.
2. A dashboard widget shows "No data" for one service, but the service is healthy. Why?
Most often the query or its tags no longer match what is being sent. Someone renamed the service, changed the env tag, or the metric name changed after an integration upgrade.
Open the widget query in Metrics Explorer, remove filters one by one until data appears, and compare the tags against the Metrics Summary page. Fix the tag at the source and use template variables on the dashboard so the next rename needs one change.
3. CPU usage on a host shows 100% on the dashboard, but the team says the host is idle. How do you check?
Check which metric and aggregation the widget uses. system.cpu.user is a percentage of all cores, while a widget that sums several hosts, or uses max over a long rollup, can show a misleading value. Compare with top on the host and with the host dashboard Datadog builds automatically.
4. You installed the Nginx integration but no Nginx metrics arrive. What next?
Run sudo datadog-agent configcheck and then sudo datadog-agent check nginx. The first shows whether the Agent loaded your conf.d/nginx.d/conf.yaml; the second runs the check once and prints the error.
The usual cause is that the Nginx status endpoint (stub_status) is not enabled or not reachable at the URL in the config. Fix the endpoint, restart the Agent and run the check again.
5. Logs from an application are not showing in Log Explorer. What do you verify?
Log collection is off by default in the Agent. Confirm logs_enabled: true in datadog.yaml, then check that a log config points at the right file path and that the dd-agent user can read the file.
logs:
  - type: file
    path: /var/log/myapp/app.log
    service: checkout
    source: python
The Logs Agent section of datadog-agent status shows each configured source and whether it is tailing. If logs arrive but you cannot find them, check whether an exclusion filter on the index is dropping them.
6. An alert fired at 3 a.m. for disk usage, then recovered two minutes later, then fired again. How do you reduce this?
The monitor is flapping around its threshold. Add a recovery threshold below the alert threshold (for example alert at 90%, recover at 85%), lengthen the evaluation window, and consider a forecast monitor for disk so you get a warning days before the disk fills instead of at the moment it crosses a line.
7. Your manager asks for a dashboard showing whether the checkout API is healthy. What do you put on it?
Start with the four golden signals for that service: request rate, error rate, latency (p50, p95, p99) and saturation. APM provides the first three per service and endpoint. Add host or container CPU and memory for saturation, a monitor summary widget, and deployment markers so people can see whether a release lines up with a change.
8. A teammate shares a screenshot where latency looks flat, but users complain about slowness. What could be wrong?
The screenshot probably shows an average. Averages hide tail latency. Look at p95 and p99, break the graph down by endpoint and by region, and check whether only one customer segment is slow. RUM data can confirm what real browsers experience.
9. You need to stop alerts during a planned database upgrade tonight. How?
Schedule a downtime scoped to the affected monitors or tags for the maintenance window. Scope it narrowly (for example service:orders-db) so unrelated alerts still page. Do not mute the whole account, and do not edit monitor thresholds for maintenance.
10. A monitor notification arrives in Slack but nobody knows what to do with it. What do you change?
Rewrite the monitor message. Include what is broken, the likely impact, a link to the runbook and the dashboard, and use conditional variables so the alert and recovery messages differ.
{{#is_alert}}
Checkout p99 latency is {{value}} ms on {{host.name}} (threshold {{threshold}} ms).
Runbook: https://wiki.example.com/runbooks/checkout-latency
@slack-checkout-oncall
{{/is_alert}}
{{#is_recovery}}Checkout latency recovered.{{/is_recovery}}
2 to 5 years of experience: scenarios 11 to 24
At this level you are expected to troubleshoot across metrics, traces and logs, run Datadog on Kubernetes, and control cost.
11. p99 latency for the payments service doubled after a release. Walk through your investigation.
Use deployment tracking to compare the new version against the previous one, then open slow traces from the new version and look at which span grew.
- Confirm the timing lines up with the deploy marker.
- In APM, compare latency by
versiontag. If only the new version is slow, the release is the suspect. - Open the slowest traces and read the flame graph. A new database query, an external call or a retry loop usually stands out.
- Pivot to the logs attached to those traces for errors or timeouts.
- Roll back if users are affected, then fix and add a latency monitor on the endpoint.
12. Traces and logs for the same request are not linked. How do you fix it?
Enable trace ID injection in the tracing library and make sure the logs are parsed as JSON or through a pipeline that extracts the trace ID. For most Datadog tracers this is DD_LOGS_INJECTION=true. The service, env and version tags on logs must also match those on traces, which is why unified service tagging matters.
13. In Kubernetes, the Datadog Agent pods are running but container metrics are missing for one namespace. What do you check?
Run agent status inside the Agent pod on an affected node, then check container include/exclude settings.
kubectl exec -it <datadog-agent-pod> -n datadog -- agent status- Check whether
DD_CONTAINER_EXCLUDEor the Helm values exclude that namespace. - Check that the Agent DaemonSet has a pod on every node, including nodes with taints that need tolerations.
- Check that the kubelet check is reporting; a kubelet TLS setting is a common cause.
14. Autodiscovery is not picking up a Redis container. What is wrong?
The annotation identifier usually does not match the container name. Autodiscovery annotations reference the container by name in the pod spec. Check the annotation key, then run agent configcheck in the Agent pod to see whether the Redis check was scheduled.
metadata:
  annotations:
    ad.datadoghq.com/redis.checks: |
      {"redisdb": {"instances": [{"host": "%%host%%", "port": "6379"}]}}
15. The monthly bill shows a jump in custom metrics. How do you find the cause?
Open the Metrics Summary and usage pages, sort custom metrics by distinct tag combinations, and find the metric whose cardinality grew. The cause is almost always a high-cardinality tag such as user_id, request_id or a full URL path.
Remove the tag in code, or use Metrics without Limits to choose which tags stay queryable for that metric. Add a review step for new metrics so the problem does not come back.
16. Log indexing costs are too high, but the security team needs all logs kept. What do you propose?
Separate ingestion from indexing. Keep ingesting everything and archive it to cloud storage, but index only what people search: errors, warnings, audit events and a sample of info logs. Use exclusion filters on the index, generate metrics from logs for the counts you graph, and rehydrate from the archive when an investigation needs old data.
17. A synthetic API test fails from one location only. Is the service down?
Probably not for everyone. A single failing location points to DNS, routing or a CDN edge problem near that location. Check the test result details (DNS resolution time, TLS handshake, response code), compare with RUM data from users in that region, and set the test to alert only when several locations fail.
18. Error rate on an endpoint is 2%, but nobody noticed for a week. What monitor was missing?
An APM error-rate monitor on that service and resource, or an SLO with a burn-rate alert. A static threshold is a start. A better answer is to define an availability SLO for the endpoint and alert when the error budget burns faster than expected, which catches slow leaks as well as sudden spikes.
19. A monitor uses avg by host over 200 hosts and pages for every single slow host. The team is overwhelmed. How do you redesign it?
Decide whether one slow host is actually a problem. If the service sits behind a load balancer, alert on the service-level metric instead, and create a separate low-priority monitor (or an outlier monitor) for individual hosts. Group notifications so one incident sends one page, not 200.
20. A Kubernetes HPA scales on a Datadog metric, but it never scales up. What do you check?
Check the Cluster Agent's external metrics provider. Confirm the Cluster Agent is running with the external metrics server enabled, that the HPA references the metric correctly, and that kubectl describe hpa shows a current value instead of an error. A wrong metric name or missing tags in the query is the common cause.
21. After moving the app to a new cloud account, traces stopped. Metrics still work. Why?
The tracer cannot reach the trace intake on the Agent. By default the tracer sends to the Agent on port 8126. In containers, the app must use the node IP or the Agent service address (often set with DD_AGENT_HOST), and the Agent must have APM enabled and the port open. Check the APM section of agent status for received traces.
22. StatsD custom metrics from an app stopped arriving after a container change. What do you check?
DogStatsD listens on UDP port 8125 by default. Confirm the app sends to the right host and port, that the Agent has non-local traffic allowed (in containers, DD_DOGSTATSD_NON_LOCAL_TRAFFIC=true) or uses a Unix domain socket, and look at the DogStatsD section of agent status for packet counts and parse errors.
23. Developers ask why the same metric shows different values in two dashboards. How do you explain it?
Different time aggregation, space aggregation or rollup. One widget may use sum across hosts and the other avg; one may roll up to 5-minute points on a long time range. Open both queries side by side and align them. This is also a good moment to explain the difference between count, rate, gauge and distribution metrics.
24. A new microservice launches next week. What Datadog setup do you require before go-live?
A short readiness checklist.
- Unified service tags set (
env,service,version). - APM tracing on, with log injection.
- Service dashboard and an owner listed in the Service Catalog.
- Monitors for error rate, latency and saturation, each with a runbook link.
- A synthetic test for the main user path.
Senior engineers and leads: scenarios 25 to 34
Senior scenarios test judgment: trade-offs, standards across teams and how you run incidents.
25. Every team builds its own monitors and nobody trusts the alerts. You are asked to fix monitoring across 40 services. Where do you start?
Start with standards, then automate them. Define a small required monitor set per service type, a tagging policy, and notification routing by team. Manage monitors and dashboards as code (Terraform's Datadog provider is a common choice) so changes are reviewed. Then measure: track pages per week per team and delete monitors that never lead to action.
26. The CTO wants one number for "is the platform reliable?" How do you answer using Datadog?
Define SLOs for the user journeys that matter, not one number for everything. Pick two or three journeys (login, search, checkout), set availability and latency SLOs from APM or synthetic data, and report error budget remaining. Explain that an SLO turns reliability into a decision rule: when the budget runs low, the team slows releases.
27. An outage happened and Datadog showed nothing until customers complained. Lead the review.
Treat it as a detection gap and run a blameless review. Build the timeline from events and deploy markers, find the first signal that changed (often a dependency or a queue), and ask why no monitor covered it. Actions usually include a monitor on the leading signal, a synthetic test for the broken path and a runbook update. Track actions to completion.
28. Two teams want different retention for logs from the same service. How do you design it?
Use multiple indexes with different retention and route logs by filter. For example, audit logs to a long-retention index, debug logs to a short one or excluded, and everything archived. Make the routing rules part of the platform standard so new services inherit them.
29. A security reviewer finds credit card numbers in logs in Datadog. What do you do?
Contain first, then fix the source. Stop the application from logging the data, use Sensitive Data Scanner rules to redact matching patterns on ingestion, restrict access to the affected index while you assess, and follow your company's incident and data-handling process. Then add scanning rules and a code review check so it does not recur.
30. Your company runs Datadog in two regions and one Datadog site. Leadership asks what happens if the network path to Datadog breaks. What is your answer?
The Agent buffers some data locally, but monitoring will have gaps. Explain that alerts depending on that data will not fire, so critical paths should also have a basic independent check (for example a cloud provider health check or a simple external probe). Mention that "no data" alerting on key monitors tells you when telemetry itself has stopped.
31. APM ingestion is expensive and engineers keep only 1% of traces. They complain they cannot find the slow requests. What do you change?
Keep the important traces instead of a flat sample. Use retention filters to keep all error traces and traces above a latency threshold, keep a lower sample of normal traffic, and use ingestion controls per service. The goal is that every slow or failed request is searchable while normal traffic is sampled.
32. Leadership wants to move from Datadog to an open-source stack to cut cost. How do you evaluate it?
Compare total cost and capability, not only license price. List what you use today (APM, logs, RUM, synthetics, security), what the open-source stack would replace it with (for example Prometheus, Grafana, Loki, Tempo and OpenTelemetry), and the engineering time to run it. Instrumenting with OpenTelemetry first keeps the option open either way, because Datadog also accepts OpenTelemetry data.
33. Two services blame each other during an incident. How do you use Datadog to settle it quickly?
Follow one slow trace end to end. The service map shows the call path, and a distributed trace shows exactly which span took the time. Share the trace link in the incident channel so both teams look at the same evidence.
34. You are asked to cut alert volume by half without missing real incidents. How?
Measure first. Export a month of monitor notifications, tag each page as actionable or not, and act on the data: delete monitors that never led to action, convert noisy symptom alerts into SLO burn-rate alerts, use composite monitors to require two conditions, and route warnings to a ticket queue instead of a pager.
End-to-end incident scenarios: 35 to 38
These longer scenarios are common in final rounds. Practise saying them out loud in about three minutes each.
35. Friday 6 p.m.: checkout errors jump to 15% and the on-call engineer pages you. Walk through the first 15 minutes.
Stabilise first, investigate second.
- Open the checkout service page: error rate, which endpoints, since when.
- Check the event stream and deploy markers. A release at 5:50 p.m. is the first suspect.
- Open a few failing traces. If they all fail at the same downstream call, check that dependency's health.
- If the release is the cause, roll back and watch the error rate recover.
- Post updates in the incident channel every few minutes with what you know and what you are doing.
- After recovery, open a review and add or tune the monitor that should have caught it earlier.
36. Memory on a Java service climbs slowly over three days, then the pods are OOM-killed. How do you investigate?
Treat it as a likely memory leak and collect evidence before the next restart. Graph JVM heap and garbage collection metrics from the Java tracer's runtime metrics, check container memory limits against usage, and correlate the start of the climb with a deploy. Use the Continuous Profiler, if enabled, to see which allocations grow. Short term, set a memory alert well before the limit; long term, fix the leak.
37. A database monitor shows connection count at the maximum, and the API is timing out. What do you do?
Find who holds the connections. Database Monitoring (or the database integration) shows active connections and slow queries. Check whether a new deploy increased pool size per pod, whether the HPA scaled out pods (each with its own pool), or whether a slow query is holding connections open. Reduce pool size or pod count, kill the runaway query if needed, and add a monitor on connection usage as a percentage of the maximum.
38. Users in one country report the site is slow, but all backend metrics look normal. How do you investigate?
Look at the user side. Filter RUM by country to see page load time, resource timing and errors. If backend latency is normal but front-end timing is slow, check the CDN, DNS and large static assets. Run synthetic browser tests from a location near those users to reproduce, and share the findings with the network or CDN team.
Common mistakes in Datadog scenario answers
| Mistake | Why it costs you | Better habit |
|---|---|---|
| Jumping straight to a fix | Sounds like guessing | Confirm and scope first |
| Trusting averages | Misses tail latency and single-region issues | Talk about p95, p99 and breakdowns by tag |
| Ignoring cost | Many teams now care about Datadog spend | Mention cardinality, indexing and sampling choices |
| No prevention step | Interviewers expect learning from incidents | End with a monitor, test or runbook change |
| Inventing features | Easy for an experienced interviewer to spot | Name only products and settings you have used or read in the docs |
How to practise these scenarios
Datadog offers a free trial, and its Learning Center has hands-on labs. Install the Agent on a small VM or a local Kubernetes cluster, break things on purpose (stop a service, fill a disk, add a slow query) and practise finding the cause. Our Datadog interview preparation guide has a study plan, and the real-time Datadog interview questions post adds more short questions.
Many interviews also test general SRE judgment. The scenario-based SRE interview questions cover incident command and error budgets in a tool-neutral way. If you want guided practice with open-source monitoring alongside Datadog concepts, our Prometheus and Grafana training covers metrics, alerting and dashboards with hands-on labs, and the DevOps training program puts monitoring in the context of CI/CD and Kubernetes.
Frequently asked questions
What is a Datadog scenario-based interview question?
It describes a real production problem, such as a latency spike, missing metrics or an alert storm, and asks how you would investigate and fix it with Datadog. Interviewers score your method and reasoning more than product trivia.
How should I structure my answer to a Datadog scenario?
Use five steps: confirm the symptom is real, scope the impact, find the cause using metrics, traces and logs, apply the smallest safe fix, then add a monitor, test or runbook so it does not happen again.
What is the first command to run when a host stops reporting to Datadog?
Run sudo datadog-agent status on the host. It shows whether the Agent is running, whether the API key is valid, which Datadog site it reports to, and whether data is being forwarded.
Why are traces and logs not linked in Datadog?
Usually trace ID injection is not enabled in the tracing library, or the logs are not parsed so the trace ID is extracted. Enabling DD_LOGS_INJECTION and consistent env, service and version tags normally fixes it.
How do I reduce Datadog alert fatigue in an interview answer?
Measure which alerts lead to action, delete the rest, add recovery thresholds to flapping monitors, alert on service-level signals instead of every host, use composite monitors and move to SLO burn-rate alerts.
What causes a sudden increase in Datadog custom metric costs?
Almost always a high-cardinality tag such as a user ID, request ID or full URL added to a metric. Find it in the Metrics Summary, remove the tag or limit queryable tags with Metrics without Limits.
Which ports does the Datadog Agent use for StatsD and traces?
By default DogStatsD listens on UDP port 8125 and the trace Agent accepts traces on port 8126. The Agent sends data to Datadog over HTTPS on port 443.
Do I need Datadog work experience to answer these scenarios?
It helps, but you can prepare with the free trial and the Datadog Learning Center labs. Install the Agent, break a test service on purpose and practise finding the cause out loud.
References
- Datadog Docs: Agent troubleshooting
- Datadog Docs: Agent commands
- Datadog Docs: Unified service tagging
- Datadog Docs: Monitor types
- Datadog Docs: Correlate logs and traces
- Datadog Docs: DogStatsD
- Datadog Docs: Metrics without Limits
- Datadog Docs: Log indexes and exclusion filters
- Datadog Docs: Kubernetes
- Google SRE Workbook: Alerting on SLOs
What's Your Reaction?
 Like
0
 Dislike
0
 Love
0
 Funny
0
 Angry
0
 Sad
0
 Wow
0