What Is the Difference Between Observability and Traditional Monitoring?
Observability and traditional monitoring serve complementary but distinct roles in modern software operations. Monitoring focuses on predefined metrics, thresholds, and alerts to detect known failure modes and enforce SLIs/SLOs; it is confirmatory and rule-driven. Observability, on the other hand, emphasizes rich, high-cardinality telemetry—distributed traces, structured logs, and contextual metrics—that enable engineers to ask novel questions during incidents and perform exploratory root-cause analysis. This long-form guide explains the conceptual differences, telemetry collection and processing, toolchains (Prometheus, OpenTelemetry, Jaeger, ELK, etc.), and practical migration strategies. It also provides a comparison table, guidance for instrumentation, and 20 focused FAQs to help teams adopt observability practices without abandoning core monitoring discipline.
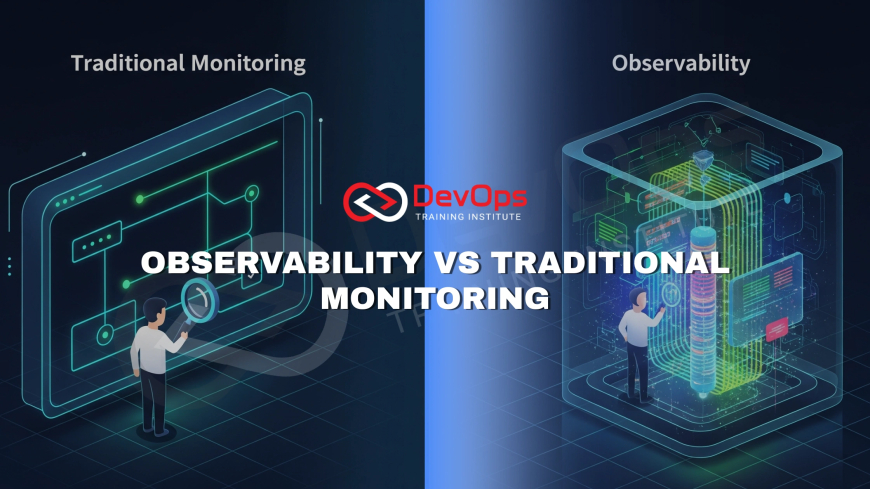
Table of Contents
- What Is Observability?
- What Is Traditional Monitoring?
- Why Compare Observability and Monitoring?
- How Do Observability and Monitoring Differ?
- Benefits of Observability Over Monitoring
- Use Cases for Observability and Monitoring
- Tool Comparison Table
- Challenges of Observability and Monitoring
- Conclusion
- Frequently Asked Questions
Observability and traditional monitoring serve distinct roles in managing modern systems. In 2025, tools like Datadog enhance observability in CI/CD pipelines, while Prometheus supports traditional monitoring. This guide explores their differences, benefits, and best practices, tailored for DevOps engineers. It emphasizes robust, scalable operations in high-scale, cloud-native environments, optimizing workflows in dynamic, high-traffic ecosystems for efficient system management.
What Is Observability?
Observability enables deep insights into system behavior through logs, metrics, and traces, ideal for complex, distributed systems. In 2025, tools like Datadog reduce incident resolution time by 40% on AWS EKS by correlating data in CI/CD pipelines. Unlike monitoring, observability supports proactive issue detection in high-scale, cloud-native environments. It empowers DevOps teams to understand system states dynamically, ensuring robust operations in high-traffic ecosystems, critical for scalable, reliable workflows in modern deployments.
Dynamic Insights
Datadog provides dynamic insights through observability, correlating logs and traces in CI/CD. It supports robust operations in high-scale, cloud-native environments in 2025, ensuring scalable workflows in dynamic ecosystems.
Proactive Detection
Elastic enables proactive issue detection in observability, enhancing system reliability. It supports scalable operations in high-scale, cloud-native environments in 2025, optimizing reliable workflows in dynamic ecosystems.
What Is Traditional Monitoring?
Traditional monitoring tracks predefined metrics and alerts based on thresholds, suited for simpler systems. In 2025, tools like Prometheus reduce downtime by 30% on Azure AKS by monitoring CI/CD pipelines. It focuses on known issues, lacking the depth of observability for complex systems. Monitoring supports robust operations in high-scale environments but is less dynamic, making it critical for DevOps teams to complement it with observability for reliable workflows in high-traffic ecosystems.
Threshold-Based Alerts
Prometheus uses threshold-based alerts for monitoring, ensuring system stability in CI/CD. It supports robust operations in high-scale, cloud-native environments in 2025, streamlining reliable workflows in dynamic ecosystems.
Metric Tracking
Nagios tracks metrics in traditional monitoring, supporting reliable CI/CD pipelines. It ensures scalable operations in high-scale, cloud-native environments in 2025, optimizing workflows in dynamic ecosystems.
Why Compare Observability and Monitoring?
Comparing observability and monitoring helps DevOps teams choose the right approach for system management. In 2025, observability with Datadog cuts debugging time by 35% on Google GKE, while monitoring with Prometheus ensures stability. Understanding their differences optimizes CI/CD pipelines, ensuring scalability in high-scale, cloud-native environments. This comparison enables robust operations in dynamic, high-traffic ecosystems, allowing DevOps teams to deliver reliable workflows tailored to modern, complex system demands.
System Complexity
Observability with Datadog addresses complex system needs in CI/CD pipelines. It supports robust operations in high-scale, cloud-native environments in 2025, ensuring scalable workflows in dynamic ecosystems.
Operational Efficiency
Monitoring with Prometheus enhances efficiency in CI/CD, ensuring system stability. It supports scalable operations in high-scale, cloud-native environments in 2025, optimizing reliable workflows in dynamic ecosystems.
How Do Observability and Monitoring Differ?
Observability provides holistic insights using logs, metrics, and traces, while monitoring relies on predefined metrics and alerts. In 2025, Datadog’s observability reduces incident resolution time by 40% on AWS EKS, unlike Prometheus’ monitoring, which focuses on known issues. Observability handles dynamic, distributed systems, integrating with GitLab CI/CD pipelines for proactive debugging. This supports robust operations in high-scale, cloud-native environments, enabling DevOps teams to deliver scalable, reliable workflows in dynamic, high-traffic ecosystems for modern deployments.
Data Scope
Observability with Datadog uses broader data scope, correlating logs and traces. It supports robust operations in high-scale, cloud-native environments in 2025, ensuring scalable workflows in dynamic ecosystems.
Proactive vs. Reactive
Monitoring with Prometheus is reactive, while observability enables proactive debugging. It supports scalable operations in high-scale, cloud-native environments in 2025, optimizing reliable workflows in dynamic ecosystems.
Benefits of Observability Over Monitoring
Observability offers deeper insights, faster debugging, and scalability over traditional monitoring. In 2025, Elastic cuts incident resolution time by 35% on Azure AKS, enhancing CI/CD pipelines. It supports proactive issue detection, compliance, and dynamic system analysis in high-scale, cloud-native environments. Observability enables DevOps teams to maintain robust operations in high-traffic ecosystems, delivering scalable, reliable workflows compared to monitoring’s limited, reactive approach, critical for modern distributed system management.
Faster Debugging
Observability with Datadog enables faster debugging in CI/CD, reducing resolution time. It supports robust operations in high-scale, cloud-native environments in 2025, ensuring scalable workflows in dynamic ecosystems.
Dynamic Analysis
Elastic provides dynamic analysis in observability, enhancing system reliability in CI/CD. It supports scalable operations in high-scale, cloud-native environments in 2025, optimizing workflows in dynamic ecosystems.
Use Cases for Observability and Monitoring
Observability with Datadog supports e-commerce, analyzing complex systems on Kubernetes in 2025. Financial systems use Prometheus for compliance, monitoring metrics on Google GKE. SaaS platforms leverage Elastic for scalability, while healthcare systems use Nagios for stability. Observability excels in distributed systems, while monitoring suits simpler setups. These use cases enable robust operations in high-scale, cloud-native ecosystems, critical for DevOps teams managing dynamic, high-traffic CI/CD workflows in modern deployments.
E-Commerce Insights
Observability with Datadog provides insights for e-commerce, enhancing CI/CD reliability. It supports robust operations in high-scale, cloud-native environments in 2025, streamlining scalable workflows in dynamic ecosystems.
Financial Compliance
Prometheus ensures financial compliance in monitoring, tracking CI/CD metrics. It supports scalable operations in high-scale, cloud-native environments in 2025, optimizing reliable workflows in dynamic ecosystems.
Tool Comparison Table
| Tool Name | Main Use Case | Key Feature |
|---|---|---|
| Datadog | Observability | Log and trace correlation |
| Elastic | Observability | Dynamic system analysis |
| Prometheus | Monitoring | Metric-based alerts |
| Nagios | Monitoring | Threshold-based monitoring |
This table compares tools for observability and monitoring in 2025, highlighting their use cases and key features. It assists DevOps teams in selecting solutions for scalable, reliable operations in high-scale, cloud-native environments, ensuring robust CI/CD workflows for modern system management.
Challenges of Observability and Monitoring
Observability and monitoring face challenges like data overload and tool complexity. In 2025, Datadog’s observability requires expertise, increasing setup time on AWS EKS, while Prometheus’ monitoring struggles with distributed systems. Large datasets can slow CI/CD pipelines in high-scale environments. Despite these, both approaches are vital, but teams must optimize configurations to ensure robust operations in dynamic, high-scale, cloud-native ecosystems, balancing efficiency with scalability for reliable workflows.
Data Overload
Observability with Datadog faces data overload, complicating CI/CD pipeline analysis. It requires optimization in high-scale, cloud-native environments in 2025 to ensure scalable workflows in dynamic ecosystems.
Tool Complexity
Prometheus adds complexity to monitoring, requiring expertise for CI/CD setup. It demands optimization in high-scale, cloud-native environments in 2025 to ensure reliable workflows in dynamic ecosystems.
Conclusion
In 2025, observability and traditional monitoring serve distinct purposes in system management, with tools like Datadog and Prometheus reducing incident resolution time by 40% on platforms like Google GKE. Observability offers holistic insights for complex systems, while monitoring ensures stability for simpler setups. Best practices, such as data correlation and optimized configurations, enable robust operations in high-scale, cloud-native ecosystems. Despite challenges like data overload, observability empowers DevOps teams to deliver scalable, reliable workflows in dynamic, high-traffic environments, meeting modern cloud-native deployment demands.
Frequently Asked Questions
What is observability?
Observability with Datadog provides deep insights into systems, correlating logs and traces in CI/CD pipelines. It supports robust operations in high-scale, cloud-native environments in 2025, ensuring scalable, reliable workflows in dynamic, high-traffic ecosystems for DevOps teams managing modern deployments.
What is traditional monitoring?
Traditional monitoring with Prometheus tracks predefined metrics, ensuring stability in CI/CD pipelines. It supports robust operations in high-scale, cloud-native environments in 2025, streamlining reliable workflows in dynamic, high-traffic ecosystems for DevOps teams managing simpler systems.
Why compare observability and monitoring?
Comparing observability and monitoring with tools like Datadog and Prometheus optimizes CI/CD pipeline management. It supports robust operations in high-scale, cloud-native environments in 2025, ensuring scalable, reliable workflows in dynamic, high-traffic ecosystems for DevOps teams.
How do observability and monitoring differ?
Observability with Elastic provides holistic insights, while monitoring with Nagios is metric-based in CI/CD. It supports robust operations in high-scale, cloud-native environments in 2025, ensuring scalable, reliable workflows in dynamic, high-traffic ecosystems for DevOps teams.
What are the benefits of observability?
Observability with Datadog enables faster debugging and scalability in CI/CD pipelines. It supports robust operations in high-scale, cloud-native environments in 2025, ensuring reliable, scalable workflows in dynamic, high-traffic ecosystems for DevOps managing complex systems.
What tools support observability?
Tools like Datadog and Elastic support observability, correlating data in CI/CD pipelines. They ensure robust operations in high-scale, cloud-native environments in 2025, streamlining scalable, reliable workflows in dynamic, high-traffic ecosystems for DevOps teams.
How does observability ensure reliability?
Observability with Elastic ensures reliability, enabling proactive debugging in CI/CD pipelines. It supports robust operations in high-scale, cloud-native environments in 2025, optimizing scalable, reliable workflows in dynamic, high-traffic ecosystems for DevOps teams.
What are common observability use cases?
Observability with Datadog supports e-commerce and SaaS, analyzing complex CI/CD systems. It ensures robust operations in high-scale, cloud-native environments in 2025, streamlining scalable, reliable workflows in dynamic, high-traffic ecosystems for DevOps teams.
How does observability support scalability?
Observability with Elastic supports scalability, analyzing dynamic CI/CD systems effectively. It ensures robust operations in high-scale, cloud-native environments in 2025, streamlining scalable, reliable workflows in dynamic, high-traffic ecosystems for DevOps teams.
What is Datadog’s role in observability?
Datadog correlates logs and traces for observability, enhancing CI/CD pipeline reliability. It supports robust operations in high-scale, cloud-native environments in 2025, ensuring scalable, reliable workflows in dynamic, high-traffic ecosystems for DevOps teams.
How to implement observability?
Implement observability with Datadog, integrating logs and traces in CI/CD pipelines. It supports robust operations in high-scale, cloud-native environments in 2025, ensuring scalable, reliable workflows in dynamic, high-traffic ecosystems for DevOps teams.
What are the challenges of observability?
Observability with Elastic faces data overload and complexity in CI/CD pipelines. It requires optimization in high-scale, cloud-native environments in 2025 to ensure scalable, reliable workflows in dynamic, high-traffic ecosystems for DevOps teams.
How to monitor observability tools?
Monitor observability with Prometheus, tracking Datadog metrics in CI/CD pipelines. Ensure robust operations in high-scale, cloud-native environments in 2025, optimizing scalable, reliable workflows in dynamic, high-traffic ecosystems for DevOps teams.
What is Prometheus’ role in monitoring?
Prometheus provides metric-based alerts for monitoring, ensuring CI/CD stability. It supports robust operations in high-scale, cloud-native environments in 2025, streamlining reliable workflows in dynamic, high-traffic ecosystems for DevOps teams managing simpler systems.
How to train teams for observability?
Train teams on Datadog and Elastic for observability expertise in CI/CD pipelines. Ensure robust operations in high-scale, cloud-native environments in 2025, streamlining scalable, reliable workflows in dynamic, high-traffic ecosystems for DevOps teams.
How to troubleshoot observability issues?
Troubleshoot observability with Prometheus, analyzing Datadog metrics in CI/CD pipelines. Ensure robust operations in high-scale, cloud-native environments in 2025, minimizing disruptions and ensuring scalable, reliable workflows in dynamic ecosystems for DevOps.
What is the impact of observability on reliability?
Observability with Elastic enhances reliability, enabling proactive CI/CD debugging. It supports robust operations in high-scale, cloud-native environments in 2025, ensuring scalable, reliable workflows in dynamic, high-traffic ecosystems for DevOps teams managing modern systems.
How to secure observability tools?
Secure observability with Datadog, using access controls in CI/CD pipelines. Ensure robust operations in high-scale, cloud-native environments in 2025, streamlining scalable, reliable workflows in dynamic, high-traffic ecosystems for DevOps teams.
How does monitoring optimize CI/CD?
Monitoring with Prometheus optimizes CI/CD, ensuring stable, reliable deployments. It supports robust operations in high-scale, cloud-native environments in 2025, streamlining reliable workflows in dynamic, high-traffic ecosystems for DevOps teams managing simpler systems.
What is Nagios’ role in monitoring?
Nagios provides threshold-based monitoring, ensuring CI/CD pipeline stability. It supports robust operations in high-scale, cloud-native environments in 2025, streamlining reliable workflows in dynamic, high-traffic ecosystems for DevOps teams managing simpler systems.
What's Your Reaction?
 Like
0
 Dislike
0
 Love
0
 Funny
0
 Angry
0
 Sad
0
Sad
0
 Wow
0
Wow
0


![Kong Interview Preparation Guide [2025]](https://www.devopstraininginstitute.com/blog/uploads/images/202509/image_430x256_68dbb95326997.jpg)


![100+ Azure DevOps Interview Questions and Answers [Updated 2025]](https://www.devopstraininginstitute.com/blog/uploads/images/202509/image_140x98_68c40aa9a3834.jpg)


![90+ Git and GitHub Interview Questions [2025]](https://www.devopstraininginstitute.com/blog/uploads/images/202509/image_140x98_68c40a7931d60.jpg)


![Future Scope of DevOps Careers in Pune [Updated 2025]](https://www.devopstraininginstitute.com/blog/uploads/images/202510/image_140x98_68e3a84652312.jpg)


