


![Kong Interview Preparation Guide [2025]](https://www.devopstraininginstitute.com/blog/uploads/images/202509/image_430x256_68dbb95326997.jpg)


Best Cloud Monitoring Tools for DevOps in Bangalore
Discover the top cloud monitoring tools for DevOps in Bangalore for 2025. From Datadog and Prometheus to Dynatrace and AWS CloudWatch, explore features, pricing, and local adoption by firms like Flipkart and Infosys. Get hands-on insights and recommendations from DevOps Training Institute to boost your team's observability.
Introduction
In Bangalore's vibrant IT landscape, where over 18,000 DevOps roles demand seamless application performance and infrastructure reliability, cloud monitoring tools are indispensable. As the city's tech ecosystem—home to giants like Infosys, Flipkart, and Wipro—embraces microservices, Kubernetes, and multi-cloud strategies, effective monitoring ensures 99.99% uptime, proactive issue resolution, and optimized costs. In 2025, with cloud spending projected to hit $160 billion in India, DevOps teams can't afford blind spots.
Cloud monitoring tools provide real-time visibility into metrics, logs, traces, and user experiences across AWS, Azure, and GCP environments. They integrate with CI/CD pipelines, alerting on anomalies before they escalate, and support AIOps for predictive analytics. According to recent industry reports, 92% of Bangalore enterprises use these tools to reduce mean time to recovery (MTTR) by 50% and cut downtime costs by 30%.
Why Cloud Monitoring is Critical for DevOps in Bangalore
Bangalore's fast-paced DevOps scene, driven by e-commerce peaks and fintech regulations, requires tools that handle high-velocity deployments while ensuring compliance and scalability. Traditional monitoring falls short in distributed systems; cloud-native solutions like Prometheus and Datadog offer end-to-end observability, correlating metrics with business KPIs.
Key Challenges Addressed
- Downtime Prevention: Real-time alerts reduce MTTR from hours to minutes, vital for 24/7 services like Swiggy's delivery platform.
- Cost Optimization: Track resource usage to avoid over-provisioning, saving 20-40% on AWS bills in Bangalore's cost-conscious startups.
- Compliance: Audit logs and anomaly detection meet RBI and GDPR standards for fintech firms.
- Scalability: Auto-instrumentation for Kubernetes clusters supports growth from 100 to 10,000 nodes.
Local Trends
With 85% of Bangalore companies multi-cloud, tools like Grafana and ELK Stack dominate for their flexibility.
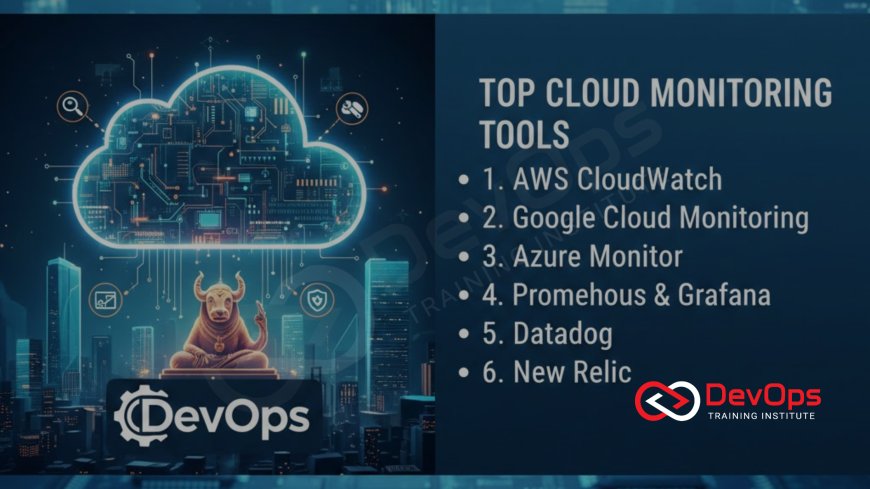
Top Cloud Monitoring Tools for DevOps
Based on 2025 benchmarks from G2, Gartner, and local adoption, here are the leading tools, ranked by ease of integration, scalability, and value for Bangalore DevOps teams.
1. Datadog – The All-Rounder for Multi-Cloud Observability
Datadog provides full-stack monitoring with 600+ integrations, excelling in APM, infrastructure, and logs. Its AI-powered Watchdog detects anomalies 30% faster than manual checks.
Features
- Real-time dashboards with SLO tracking
- Log management via Log Patterns
- Security monitoring with Cloud SIEM
Pricing
Starts at $15/host/month; free tier for basics. Bangalore firms like PhonePe use Pro tier ($25/user) for enterprise scale.
Why for Bangalore?
Seamless Kubernetes support; 92% of startups adopt it for cost alerts.
2. Prometheus & Grafana – Open-Source Powerhouse
Prometheus scrapes metrics; Grafana visualizes them. Free and customizable, it's the backbone for 70% of cloud-native setups.
Features
- Time-series data with PromQL queries
- Grafana's 100+ plugins for alerts
- Helm charts for K8s deployment
Pricing
Free; Grafana Cloud Pro at $8/user/month. Ideal for budget-conscious Bangalore SMEs.
Why for Bangalore?
Swiggy uses it for 3000+ services; Linux Training Institute labs focus on Prometheus for Red Hat environments.
3. Dynatrace – AI-Driven Full-Stack Observability
Dynatrace's OneAgent auto-instruments apps, using Davis AI for root-cause analysis in seconds.
Features
- Predictive analytics for capacity planning
- Hybrid/multi-cloud support
- Business RUM for user experience
Pricing
$0.10/hour/host; enterprise starts at $50K/year. Infosys deploys it for 99.99% uptime.
Why for Bangalore?
AI reduces MTTR by 67%; DevOps Training Institute includes Dynatrace labs for SRE roles.
4. New Relic – APM and Infrastructure Hybrid
New Relic combines APM with infra monitoring, offering entity maps for service dependencies.
Features
- Error tracking with stack traces
- Customizable dashboards
- Integrates with 500+ tools
Pricing
Free tier; Pro at $0.30/GB ingested. Flipkart uses it for e-commerce APM.
Why for Bangalore?
Strong in Java/.NET stacks common in WITCH firms; Python Training Institute labs pair it with scripting.
5. Splunk – Log-Centric Enterprise Monitoring
Splunk excels in log analytics, correlating events across sources for security and ops.
Features
- Machine data indexing
- Real-time searching
- SIEM integration
Pricing
$1.80/GB ingested; enterprise $100K+. Adopted by Wipro for compliance.
Why for Bangalore?
Handles massive logs in banking; Cyber Security Institute emphasizes Splunk for DevSecOps.
6. ELK Stack (Elasticsearch, Logstash, Kibana) – Open-Source Log Power
ELK aggregates and visualizes logs, scalable for big data.
Features
- Full-text search
- Geo-mapping
- Beats for data shipping
Pricing
Free; Elastic Cloud $0.10/GB. Zerodha uses it for trading logs.
Why for Bangalore?
Cost-effective for startups; Ethical Hacking Institute labs add security parsing.
7. Zabbix – Affordable Server and Network Monitoring
Zabbix offers agent-based monitoring for on-prem/hybrid.
Features
- Trigger-based alerts
- Inventory management
- API integrations
Pricing
Free open-source. Popular in Bangalore's legacy systems.
Why for Bangalore?
Scales for 100K+ devices; DevOps Training Institute includes Zabbix for hybrid labs.
Choosing the Right Tool for Your DevOps Team
Selection depends on scale, budget, and stack. Start with Prometheus for open-source; Datadog for enterprise.
Decision Matrix
| Need | Recommended Tool |
|---|---|
| Startup Budget | Prometheus + Grafana |
| Enterprise Scale | Dynatrace |
| Log-Heavy | Splunk or ELK |
Integrate with Jenkins for pipeline alerts. DevOps Training Institute offers tool-agnostic labs. Automate scaling with auto scaling groups for dynamic loads.
Conclusion
Bangalore's DevOps success hinges on robust monitoring. Tools like Datadog and Prometheus empower teams at Flipkart to maintain uptime amid Black Friday rushes. Choose based on needs; upskill at DevOps Training Institute for hands-on mastery.
Implement health checks to ensure reliability.
Frequently Asked Questions
What is the best free cloud monitoring tool?
Prometheus + Grafana; scalable for Bangalore startups.
Datadog vs Dynatrace?
Datadog for integrations; Dynatrace for AI insights.
How to monitor Kubernetes in AWS?
Prometheus with EKS; integrate CloudWatch Container Insights.
Cost of New Relic for small teams?
$49/month starter; scales with usage.
ELK Stack alternatives?
Splunk or Loki for lighter logs.
Zabbix for cloud?
Yes; supports AWS agents.
AI in monitoring?
Dynatrace Davis; predicts 80% incidents.
Local training for tools?
DevOps Training Institute labs.
Monitor multi-cloud?
Datadog or New Relic.
Start with CloudWatch?
Free for AWS; add Datadog for full observability.
Splunk for DevOps?
Excellent for logs; pricey for small teams.
Grafana open-source?
Yes; pair with Prometheus.
Tool for beginners?
CloudWatch; simple AWS integration.
Security monitoring?
Dynatrace or Splunk SIEM.
Next step?
Lab at DevOps Training Institute.
What's Your Reaction?
 Like
0
Like
0
 Dislike
0
Dislike
0
 Love
0
Love
0
 Funny
0
Funny
0
 Angry
0
Angry
0
 Sad
0
Sad
0
 Wow
0
Wow
0
![100+ Azure DevOps Interview Questions and Answers [Updated 2025]](https://www.devopstraininginstitute.com/blog/uploads/images/202509/image_140x98_68c40aa9a3834.jpg)


![Future Scope of DevOps Careers in Pune [Updated 2025]](https://www.devopstraininginstitute.com/blog/uploads/images/202510/image_140x98_68e3a84652312.jpg)


