


![Kong Interview Preparation Guide [2025]](https://www.devopstraininginstitute.com/blog/uploads/images/202509/image_430x256_68dbb95326997.jpg)


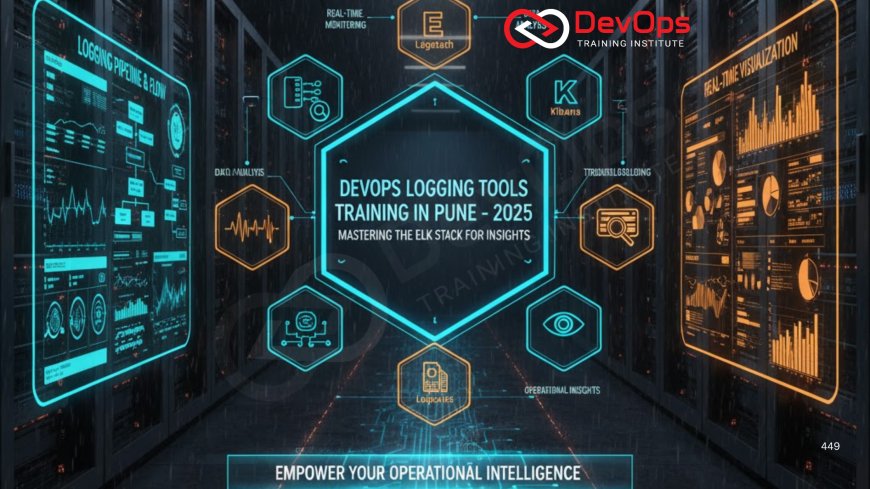
DevOps Logging Tools Training in Pune (ELK Stack)
Discover the power of ELK Stack for DevOps logging through comprehensive training in Pune. This guide explores the ELK Stack components (Elasticsearch, Logstash, Kibana), their role in log management, real-world applications, setup steps, best practices, case studies, and future trends. Perfect for beginners and professionals aiming to master log analysis for DevOps.
Introduction
In the fast-paced world of DevOps, managing and analyzing logs is crucial for maintaining system performance, troubleshooting issues, and ensuring security. The ELK Stack, comprising Elasticsearch, Logstash, and Kibana, has emerged as a leading open-source solution for centralized logging, helping teams gain insights from vast amounts of data. If you’re in Pune and looking to enhance your DevOps skills, training in ELK Stack offers a practical way to master log management. This blog post is your guide to understanding the ELK Stack, its components, how it transforms DevOps workflows, and why Pune is an ideal place for such training. Written in simple language, it’s designed for beginners and seasoned professionals alike. We’ll cover setup steps, best practices, real-world applications, case studies, and future trends to help you leverage ELK Stack effectively.
As organizations increasingly adopt DevOps practices, the need for robust logging tools has grown. Reports from 2025 highlight ELK Stack’s dominance in log management, with its ability to handle massive datasets in real time. Let’s explore how ELK Stack training in Pune can empower you to streamline DevOps processes and stay ahead in the industry landscape.
Understanding the ELK Stack
What is the ELK Stack?
The ELK Stack is a powerful set of open-source tools designed for log management and analysis. It consists of three main components: Elasticsearch, Logstash, and Kibana. Elasticsearch stores and indexes logs for fast retrieval, Logstash processes and transforms log data, and Kibana provides a user-friendly interface for visualizing logs. Together, they enable teams to collect, store, and analyze logs from various sources, such as servers, applications, and cloud environments.
Why ELK Stack for DevOps?
In DevOps, logs are critical for monitoring system health, detecting errors, and identifying security threats. The ELK Stack excels at centralizing logs from multiple systems, making it easier to spot patterns and troubleshoot issues. Its open-source nature, scalability, and flexibility make it a top choice for DevOps teams. A 2025 report from Datadog notes that ELK Stack is widely used for its ability to handle complex, high-volume log data in real time.
How ELK Stack Enhances Workflows
By centralizing logs, ELK Stack reduces the time spent searching for issues across disparate systems. It supports real-time monitoring, alerting, and visualization, enabling faster incident response. For DevOps professionals in Pune, mastering ELK Stack through training can unlock career opportunities in system administration and cloud operations, as companies seek expertise in log management.
Components of the ELK Stack
Elasticsearch
Elasticsearch is a distributed search and analytics engine that stores log data in a structured format. It uses indexing to enable rapid searches, making it ideal for querying large datasets. For example, a DevOps team can use Elasticsearch to quickly find error logs from a specific application during an outage.
Logstash
Logstash is the data processing pipeline of the ELK Stack. It collects logs from various sources, such as system files or application outputs, parses them into a structured format, and sends them to Elasticsearch. Logstash supports plugins for customizing data processing, allowing flexibility for different log types.
Kibana
Kibana is the visualization layer, offering dashboards, charts, and graphs to make log data accessible. DevOps teams use Kibana to create real-time visualizations, such as error rate trends or server performance metrics, helping them make informed decisions quickly.
These components work together to provide a seamless log management solution, transforming raw data into actionable insights for DevOps workflows.
Why Choose ELK Stack Training in Pune?
Pune’s Tech Ecosystem
Pune is a thriving hub for IT and DevOps, with numerous tech companies and startups adopting ELK Stack for log management. Training institutes in Pune offer hands-on courses tailored to industry needs, making it an ideal location to learn ELK Stack. Programs often include practical labs, real-world projects, and certification preparation to boost your career.
Benefits of Training
ELK Stack training equips you with skills to set up, configure, and optimize logging systems. You’ll learn to handle real-time log analysis, create dashboards, and troubleshoot issues efficiently. With Pune’s growing demand for DevOps professionals, training in ELK Stack can set you apart in the job market.
Industry Relevance
As organizations in Pune adopt cloud and microservices architectures, the need for centralized logging grows. ELK Stack’s ability to integrate with tools like Docker and Kubernetes makes it invaluable. Training ensures you’re ready to tackle these modern challenges.
Setting Up the ELK Stack
Installation Requirements
To set up ELK Stack, you need a server with sufficient memory and storage, typically running a Linux distribution like Ubuntu or CentOS. Ensure Java is installed, as Elasticsearch and Logstash depend on it. A basic setup requires at least 4GB of RAM and 2 CPU cores, though production environments may need more.
Step-by-Step Installation
First, install Elasticsearch by downloading its package and configuring it to start automatically. Next, set up Logstash, defining input and output pipelines to process logs. Finally, install Kibana and connect it to Elasticsearch for visualization. Training in Pune often includes guided labs to practice these steps on virtual machines.
Configuration Tips
Configure Logstash to parse logs from specific sources, such as Apache or Nginx. Use Elasticsearch indices to organize data by date or application. Set up Kibana dashboards to monitor key metrics, like server uptime or error rates. Regular maintenance, such as index rotation, ensures optimal performance.
These steps form the foundation of ELK Stack usage, which you’ll master through hands-on training.
Using ELK Stack in DevOps Workflows
Log Aggregation
ELK Stack centralizes logs from multiple sources, such as servers, containers, and cloud services. This eliminates the need to check individual systems, saving time during troubleshooting. For example, a DevOps engineer can aggregate logs from a Kubernetes cluster to identify pod failures.
Real-Time Monitoring
Kibana’s real-time dashboards allow teams to monitor system health instantly. You can track metrics like CPU usage, response times, or error spikes, enabling proactive issue resolution. Training in Pune often covers creating custom dashboards for specific use cases.
Alerting and Incident Response
ELK Stack supports alerting through plugins like ElastAlert or integrations with tools like Slack. You can set up alerts for anomalies, such as sudden traffic spikes, to respond quickly. This capability is critical for maintaining service reliability in DevOps environments.
By mastering these features, you’ll enhance your ability to manage complex systems efficiently.
Best Practices for ELK Stack
Optimize Performance
To handle large log volumes, optimize Elasticsearch by adjusting index settings and shard allocation. Use Logstash filters to reduce unnecessary data processing. Training courses in Pune teach performance tuning techniques to ensure ELK Stack runs smoothly in production.
Secure the Stack
Secure ELK Stack by enabling authentication, using SSL for data transmission, and restricting access to Kibana dashboards. Regular updates and patches are crucial to protect against vulnerabilities. Pune training programs often include security best practices for ELK deployments.
Backup and Recovery
Regularly back up Elasticsearch indices to prevent data loss. Configure snapshot policies to store backups on external storage. Training covers disaster recovery strategies, ensuring you can restore logs quickly in case of failures.
Scalability
For high-traffic environments, scale ELK Stack by adding nodes to the Elasticsearch cluster. Use load balancers for Logstash and optimize Kibana for multiple users. These techniques are part of advanced training modules in Pune.
Following these practices ensures a robust and reliable logging system for DevOps teams.
Real-World Applications of ELK Stack
Application Performance Monitoring
ELK Stack is widely used to monitor application performance. For example, a Pune-based e-commerce company might use Kibana to track API response times, identifying bottlenecks during peak traffic. Training helps you build dashboards tailored to such scenarios.
Security and Compliance
Security teams use ELK Stack to detect threats by analyzing logs for suspicious activity, like unauthorized login attempts. It also helps meet compliance requirements by storing audit logs. Pune training often includes case studies on security use cases.
Infrastructure Monitoring
DevOps teams use ELK Stack to monitor servers and cloud infrastructure. For instance, logs from AWS services can be ingested into ELK to track resource usage. Training covers integrations with cloud platforms, enhancing your skills in modern DevOps environments.
These applications demonstrate ELK Stack’s versatility, making it a must-learn tool for DevOps professionals.
Case Studies
E-Commerce Platform in Pune
A Pune-based e-commerce startup implemented ELK Stack to monitor its microservices architecture. By aggregating logs from Docker containers, the team identified and resolved a payment gateway issue within hours, reducing downtime. Training in Pune helped their DevOps team set up custom Kibana dashboards for real-time insights.
Financial Services Firm
A financial services company used ELK Stack to comply with regulatory requirements. By analyzing logs for suspicious transactions, they detected a potential security breach early. Pune training provided hands-on experience in configuring alerts for such scenarios.
IT Consultancy
An IT consultancy in Pune adopted ELK Stack to monitor a hybrid cloud environment. By integrating logs from on-premises servers and AWS, they improved incident response times. Training equipped their team with skills to scale ELK for large datasets.
These cases highlight how ELK Stack training in Pune translates into real-world success.
Future Trends in ELK Stack and DevOps Logging
AI and Machine Learning Integration
AI is enhancing ELK Stack’s capabilities, with machine learning plugins for anomaly detection. Future versions may offer predictive analytics, helping DevOps teams anticipate issues. Training in Pune is evolving to include AI-driven logging techniques.
Cloud-Native Logging
As cloud adoption grows, ELK Stack is adapting for cloud-native environments like Kubernetes. Future training will focus on integrations with cloud platforms, ensuring DevOps professionals stay relevant.
Automation and Observability
Automation tools will streamline ELK Stack operations, such as index management and alert configuration. Observability, combining logs, metrics, and traces, will become a focus, with Pune training programs incorporating these trends.
These advancements make ELK Stack training a valuable investment for future-proofing your career.
Conclusion
The ELK Stack is a cornerstone of DevOps logging, offering powerful tools to manage and analyze logs effectively. This guide has explored its components, setup process, role in DevOps workflows, best practices, real-world applications, case studies, and future trends. By pursuing ELK Stack training in Pune, you can gain hands-on skills to implement centralized logging, monitor systems, and enhance security. With Pune’s thriving tech ecosystem and industry-focused courses, now is the perfect time to master ELK Stack. Stay proactive, learn these tools, and elevate your DevOps career to new heights.
Frequently Asked Questions
What is the ELK Stack?
It’s an open-source suite of tools (Elasticsearch, Logstash, Kibana) for collecting, storing, and visualizing log data in DevOps environments.
Why is ELK Stack important for DevOps?
It centralizes logs, enables real-time monitoring, and supports troubleshooting, making it essential for system reliability and performance.
What does Elasticsearch do?
Elasticsearch stores and indexes log data, allowing fast searches and analytics for large datasets.
How does Logstash work?
Logstash collects and processes logs from various sources, transforming them into a structured format for storage in Elasticsearch.
What is Kibana’s role?
Kibana provides visualizations and dashboards to analyze log data, helping DevOps teams monitor and troubleshoot systems.
Why choose ELK Stack training in Pune?
Pune’s tech hub offers industry-focused courses with hands-on labs, preparing you for real-world DevOps challenges.
What are the hardware requirements for ELK Stack?
A server with at least 4GB RAM, 2 CPU cores, and a Linux distribution like Ubuntu is needed for basic setups.
How do I set up ELK Stack?
Install Elasticsearch, Logstash, and Kibana, configure pipelines, and connect them for log processing and visualization.
Can ELK Stack handle cloud logs?
Yes, it integrates with cloud platforms like AWS and Kubernetes, making it ideal for cloud-native environments.
What are best practices for ELK Stack?
Optimize performance, secure the stack, back up indices, and scale for large datasets to ensure reliability.
How does ELK Stack aid security?
It analyzes logs for suspicious activity, helping detect threats and meet compliance requirements.
What is log aggregation in ELK Stack?
It collects logs from multiple sources into a centralized system, simplifying analysis and troubleshooting.
Can beginners learn ELK Stack?
Yes, training in Pune offers beginner-friendly courses with practical labs to build skills from scratch.
How does ELK Stack support real-time monitoring?
Kibana’s dashboards provide real-time insights into system metrics, enabling quick incident response.
What’s next for ELK Stack in DevOps?
Expect AI-driven analytics, cloud-native integrations, and enhanced observability in future updates.
What's Your Reaction?
 Like
0
Like
0
 Dislike
0
Dislike
0
 Love
0
Love
0
 Funny
0
Funny
0
 Angry
0
Angry
0
 Sad
0
Sad
0
 Wow
0
Wow
0


![100+ Azure DevOps Interview Questions and Answers [Updated 2025]](https://www.devopstraininginstitute.com/blog/uploads/images/202509/image_140x98_68c40aa9a3834.jpg)


![Future Scope of DevOps Careers in Pune [Updated 2025]](https://www.devopstraininginstitute.com/blog/uploads/images/202510/image_140x98_68e3a84652312.jpg)


