10 Kubernetes Pod Troubleshooting Techniques
Master the 10 most effective Kubernetes Pod troubleshooting techniques every DevOps Engineer must know to quickly diagnose and resolve deployment failures, crashes, and connectivity issues in cloud-native environments. This essential guide covers key commands like kubectl describe, logs, and exec, along with deep dives into common errors like CrashLoopBackOff and ImagePullBackOff. Learn how to check container status, inspect events, diagnose networking failures, and verify resource limits to ensure your applications achieve and maintain high availability and resilience within the Kubernetes orchestration platform, guaranteeing continuous service delivery and stability.
Introduction
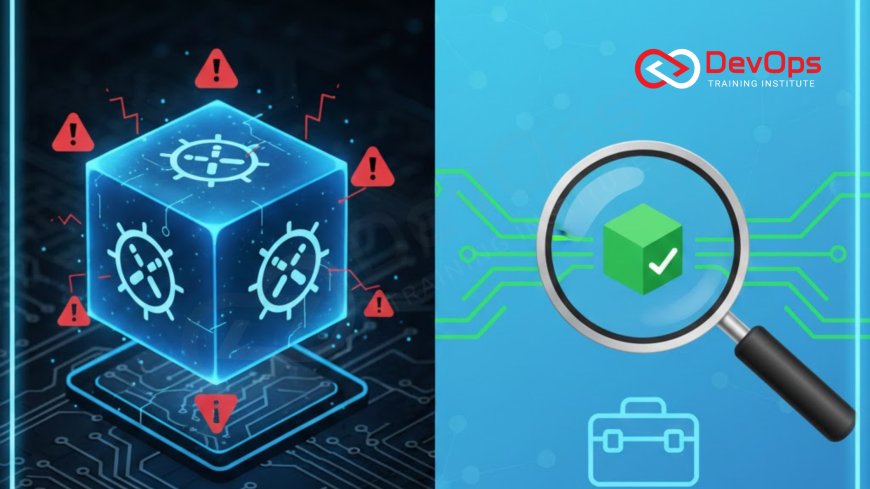
Kubernetes (K8s) is the powerful engine that drives modern cloud-native architecture, providing the orchestration necessary to deploy, scale, and manage containerized applications with unprecedented resilience. However, the complexity that grants this power also makes troubleshooting a failing application challenging. When a Pod—the smallest deployable unit in Kubernetes—fails to start, crashes repeatedly, or cannot communicate with other services, a DevOps Engineer must quickly and systematically diagnose the root cause across several layers: the container itself, the Pod definition, the underlying node resources, and the cluster network. The ability to efficiently troubleshoot Pods is the single most critical skill for maintaining the high reliability required of production systems, directly influencing the Mean Time to Recovery (MTTR) during an incident.
Troubleshooting in Kubernetes moves beyond traditional server management because Pods are often ephemeral, disposable, and tightly integrated into a dynamic network. Instead of logging into a single server, you rely on declarative commands (kubectl) to inspect the application's state, logs, and metadata. This guide outlines the 10 best and most frequently used techniques—a structured, systematic approach—that every engineer should master. By learning to harness the power of kubectl for deep inspection and understanding the common failure modes, you can turn a confusing production outage into a predictable, manageable process, guaranteeing that your services quickly return to a healthy, operating state, fulfilling the core promise of the Kubernetes orchestration platform.
The systematic approach to debugging a failing Pod begins with gathering immediate external context, moving inward to the Pod's definition, then into the container's logs and execution environment. This flow ensures that common misconfigurations (like networking or resource limits) are ruled out before diving into application-specific code issues, providing a repeatable path to incident resolution, regardless of whether the application is running in a managed cloud environment or an on-premise cluster using containerization for scalability.
Phase 1: Initial Context and Status Gathering
Before attempting any fix, the first crucial step is gathering all external data and status information available about the problematic Pod. Kubernetes provides powerful built-in reporting tools designed to give a comprehensive, yet concise, view of the Pod's current state and its history of recent activity. These initial steps often reveal the root cause without requiring a deeper dive into the application code or the container's internal processes, saving precious time during a live incident.
1. Check the Pod Status and Lifecycle (kubectl get pods): The absolute first command. Executing kubectl get pods (with the relevant namespace) immediately shows the Pod's status: Running, Pending, Error, CrashLoopBackOff, or ImagePullBackOff. The status code itself provides the first hint: Pending usually indicates a scheduling issue (no available resources or misconfigured node selectors), while CrashLoopBackOff indicates the application container is starting and then immediately crashing repeatedly, signaling an issue with the entrypoint or application logic.
2. Inspect Pod Events and Conditions (kubectl describe): The kubectl describe pod [pod-name] command is arguably the most valuable troubleshooting tool. It dumps a wealth of metadata, including the Pod's YAML definition, current resource utilization, container status tables, and, most critically, the Events section. The Events section contains a chronological log of all actions taken by the Kubernetes scheduler and Kubelet, such as scheduling failures, image pulling errors, volume attachment issues, or why a container failed to start (e.g., "Error: CrashLoopBackOff: exit code 1"). Always check the events first to identify the immediate failure mechanism and pinpoint the stage of the Pod's lifecycle where the error occurred.
3. Review Detailed Container Status: After running describe, pay close attention to the Container Status fields for the problematic container. Key fields to check include: Last State (shows the reason and exit code from the previous container termination, which is vital for CrashLoopBackOff), Ready (indicates if the container is ready to serve traffic based on readiness probes), and Restarts (a high number of restarts confirms a recurring crash issue). A non-zero exit code in the Last State is the primary piece of information leading to the root application failure, directing the engineer to the likely source of the problem, which often lies in the application code itself.
Phase 2: Internal Container and Configuration Diagnostics
Once you understand the Pod's external status, the next phase involves diving into the container itself—examining logs, checking runtime processes, and verifying the application's configuration within its environment. Most application failures originate here, caused by code exceptions, missing environment variables, or incorrect commands executed at startup. This requires interacting directly with the container's output and its running shell environment.
4. View Container Logs (kubectl logs): The kubectl logs [pod-name] -c [container-name] command retrieves standard output (stdout) and standard error (stderr) from the container's primary process. For a failing application, the crash's root cause—such as a configuration file not found, a database connection failure, or a critical application exception—will almost certainly be present in the logs. If the Pod is stuck in CrashLoopBackOff, use --previous (or -p) flag to view the logs from the previous, failed container instance, ensuring you capture the output that caused the most recent termination before the container was automatically restarted by the orchestration system.
5. Interact with the Running Container (kubectl exec): The kubectl exec -it [pod-name] -- /bin/bash command allows you to run commands inside a running container, similar to SSH-ing into a server. This is invaluable for runtime checks. You can use it to verify application dependencies, check local configuration files (in directories like `/etc` or the application's home directory), test local networking (using curl or ping inside the container), or examine the state of running processes (using Linux tools like ps). This step is crucial for verifying the environment's integrity before blaming the application code.
6. Verify Application Configuration: The container may be running correctly, but the application is failing due to incorrect external settings. Using kubectl describe pod again, confirm that environment variables are correctly injected (via ConfigMaps or Secrets) and that volumes are mounted correctly. An application failing to connect to its database is often due to a missing environment variable or a misconfigured ConfigMap. Verify that the secrets being consumed are not empty or incorrectly base64 encoded, which can silently break connectivity before the application attempts to access the external service.
Phase 3: Network, Resource, and Node Diagnostics
If the container is healthy but the service is unreachable or unstable, the issue often lies in the network, resource constraints, or the health of the host node. Kubernetes networking, often relying on CNI plugins, can be complex, and failures here often manifest as intermittent connectivity issues between microservices. Similarly, resource exhaustion on the host node can lead to the Kubelet evicting the Pod to protect the node's stability.
7. Diagnose Service and Network Connectivity: Use kubectl get service [service-name] to ensure the service correctly points to the Pod and that the Pod's labels match the Service's selector. From an external Pod in the same network, use curl [service-name]:[port] to test cluster-internal communication, verifying DNS resolution and service routing. If external connectivity fails, inspect the Ingress or LoadBalancer resource to ensure it correctly routes traffic to the Service's external IP, which often relies on complex physical addressing or cloud-native network configurations.
8. Verify Resource Limits and Requests: Pods require defining resource requests (guaranteed resources) and limits (maximum resources) for CPU and memory. If a container repeatedly crashes and restarts, the cause might be the Pod exceeding its memory limit, triggering an OOMKilled (Out Of Memory Killed) event by the Kubelet. Use kubectl describe pod to check the QoS Class and Limits section. If OOMKilled is present in the events, increase the memory limit in the Pod specification to prevent the container from being prematurely terminated by the kernel's resource governor.
9. Check the Node Health and Scheduling Status: If the Pod remains in a Pending state, the issue is likely with scheduling. Use kubectl describe pod and inspect the Events section for messages like "Insufficient CPU" or "NodeUnschedulable." This indicates that the Pod's resource requests exceed the available capacity on the cluster nodes. Next, check the target Node's health using kubectl describe node [node-name] to view its resource capacity, allocated resources, and any taint or condition (such as MemoryPressure) that might be preventing the Pod from being scheduled onto that node, often requiring manual node cleanup or scaling.
Phase 4: Advanced Probes and Lifecycle Hooks
This final phase focuses on checking the reliability mechanisms built into the Pod specification that are intended to self-heal and manage the application lifecycle. Misconfigured probes are a frequent cause of production instability, as Kubernetes will incorrectly terminate healthy applications or keep routing traffic to unhealthy ones, leading to intermittent service errors and downtime.
10. Inspect Readiness and Liveness Probes: These probes are the Pod's internal communication channel with the Kubelet, indicating if the container is healthy (Liveness) and ready to receive traffic (Readiness). Incorrectly configured probes, such as a Readiness Probe that checks the database connection before the application has fully initialized, can cause the Service's endpoint to route traffic to a failing Pod, resulting in 503 errors. Use kubectl describe pod to check the probe definitions and verify that the defined path or command (e.g., HTTP GET or exec command) is functioning correctly inside the container. Correcting these definitions is vital for application resilience, as a failing Liveness Probe leads to the continuous restart cycle known as CrashLoopBackOff, even if the application technically starts without immediately throwing an exception.
| # | Technique | Primary kubectl Command | Common Issues Detected | Troubleshooting Phase |
|---|---|---|---|---|
| 1 | Check Pod Status | kubectl get pods | ImagePullBackOff, Pending, CrashLoopBackOff | Initial Context |
| 2 | Inspect Events/Metadata | kubectl describe pod | Scheduling failures, OOMKilled events, volume mounting errors | Initial Context |
| 4 | View Container Logs | kubectl logs -f [pod] --previous | Application exceptions, config file errors, database connection failures | Internal Diagnostics |
| 5 | Interact/Debug Runtime | kubectl exec -it [pod] -- /bin/bash | Verify local configuration, test internal network connectivity, inspect processes | Internal Diagnostics |
| 8 | Verify Resource Limits | kubectl describe pod (Limits section) | OOMKilled events, CPU throttling, insufficient scheduling resources | Node/Resource Diagnostics |
Advanced Failure Modes and Next Steps
A deeper understanding of Pod failure modes allows for faster remediation. For instance, the ImagePullBackOff state, where the Kubelet cannot pull the required container image, indicates an issue outside the application code itself. Common root causes here include: incorrect image name or tag in the deployment manifest, a private container registry requiring authentication credentials (ImagePullSecrets) that were not configured, or a transient cluster network failure blocking communication with the external registry. Diagnosing this involves checking the node's network connectivity and verifying the secret configuration against the registry documentation, which is often a fundamental challenge in multi-cloud deployments.
Another common and often complex issue is network segmentation or policy enforcement failures that block inter-Pod communication. This occurs when NetworkPolicies (Kubernetes' built-in firewall rules for Pods) are misconfigured, inadvertently blocking communication between a web service and its backing database service. Debugging this requires checking the NetworkPolicy definitions, verifying the Pod's labels and selectors that define the policy's targets, and understanding how the Pod's IP address relates to its host's network, which is a specialized skill reliant on knowledge of how networking concepts like ports and protocols are virtualized within the cluster CNI (Container Network Interface).
When the root cause is determined (e.g., missing environment variable, application code bug), the fix must be applied to the declarative manifest (the Deployment YAML) or the application source code. Since Pods are immutable and should not be fixed manually, the ultimate resolution requires updating the Deployment manifest with the correct configuration or triggering a new CI/CD pipeline run with the corrected code. This commitment to fixing the source definition in Git, rather than patching the running system, is core to the DevOps methodology and the principle of declarative, version-controlled infrastructure that underpins Kubernetes.
Conclusion
Troubleshooting a failing Pod is a systematic, multi-layered process that transforms complex, distributed system chaos into a manageable series of diagnostics. By mastering these 10 techniques—starting with kubectl get/describe to gather external context, moving to kubectl logs/exec for internal inspection, and finally validating networking, resources, and probes—a DevOps Engineer can rapidly pinpoint the source of instability. The most effective resolution always involves fixing the underlying declarative source (the YAML configuration or the application code) and relying on Kubernetes' orchestration capabilities to automatically deploy the correct, self-healing version.
The resilience of a modern cloud-native application is directly proportional to the team's proficiency in debugging it. Kubernetes provides the visibility; the engineer must provide the rigorous, systematic approach. This systematic process ensures that even common but critical failures like CrashLoopBackOff or ImagePullBackOff are swiftly resolved, ensuring maximum availability and proving that the team is capable of managing the inherent complexity of container orchestration environments with confidence and precision, maintaining the service stability that is crucial for business continuity and customer satisfaction.
Frequently Asked Questions
What is the difference between a Pod and a Container?
A Container holds the application, but a Pod is the smallest unit Kubernetes manages, hosting one or more containers that share network and storage resources.
How do you check for resource exhaustion on a Pod?
Use kubectl describe pod to check the Events section for an OOMKilled (Out Of Memory Killed) status, indicating the Pod exceeded its memory limits.
What does the CrashLoopBackOff status indicate?
It indicates that the container is repeatedly starting and immediately crashing, signaling a fatal error in the container's entrypoint command or the application logic.
How do you view logs from a previous failed container?
Use the kubectl logs [pod-name] --previous (or -p) flag to retrieve the logs from the container instance that failed and caused the latest restart event.
What causes an ImagePullBackOff error?
It is caused by Kubernetes being unable to pull the container image, typically due to an incorrect image name/tag, private registry authentication failure (missing ImagePullSecrets), or a network issue.
What is the primary tool for initial Pod diagnostics?
The primary tool is kubectl describe pod [pod-name], as it provides all metadata, resource usage, and crucial event history in one command output.
How are environment variables usually checked at runtime?
They are checked at runtime by using the kubectl exec -it [pod-name] -- env command, which dumps all environment variables active within the container's execution shell.
What are Readiness Probes used for?
Readiness Probes signal whether a Pod is ready to receive network traffic, ensuring that the Service endpoint only routes requests to fully initialized and healthy application instances.
How do you verify connectivity between two Pods?
Use kubectl exec into one Pod and then use the curl or ping command to try and connect to the Service name or IP address of the target Pod, verifying network rules.
Why should you not manually fix a crashing Pod?
You should not manually fix it because the fix will be lost upon the next restart or termination, and Kubernetes will revert to the broken declarative state defined in the Deployment YAML.
What should you check if a Pod is stuck in the Pending state?
Check the Events section of kubectl describe pod for scheduling errors like "Insufficient CPU" or "NodeUnschedulable," indicating resource limitations or node issues.
How do NetworkPolicies affect troubleshooting?
NetworkPolicies act as firewalls, and troubleshooting requires verifying that the Pod's labels and selectors match the policy rules to avoid inadvertently blocking legitimate application communication.
What is the core difference between Liveness and Readiness Probes?
A Liveness Probe checks if the application is alive (if it fails, the container restarts); a Readiness Probe checks if it's ready to serve traffic (if it fails, the Pod is removed from the Service endpoint).
Why are Pods considered ephemeral?
Pods are considered ephemeral because they can be automatically terminated and replaced at any time by the Kubernetes controller due to scaling, node failure, or internal crashes.
How does Linux history relate to Pod debugging?
The Linux history of operating systems and kernel features underpins containerization and resource isolation (Cgroups, Namespaces), which is vital for diagnosing low-level Pod issues.
What's Your Reaction?
 Like
0
 Dislike
0
 Love
0
 Funny
0
 Angry
0
 Sad
0
Sad
0
 Wow
0
Wow
0


![Kong Interview Preparation Guide [2025]](https://www.devopstraininginstitute.com/blog/uploads/images/202509/image_430x256_68dbb95326997.jpg)



![100+ Azure DevOps Interview Questions and Answers [Updated 2025]](https://www.devopstraininginstitute.com/blog/uploads/images/202509/image_140x98_68c40aa9a3834.jpg)


![90+ Git and GitHub Interview Questions [2025]](https://www.devopstraininginstitute.com/blog/uploads/images/202509/image_140x98_68c40a7931d60.jpg)


![Future Scope of DevOps Careers in Pune [Updated 2025]](https://www.devopstraininginstitute.com/blog/uploads/images/202510/image_140x98_68e3a84652312.jpg)


