















SRE Interview Preparation Guide: 8-Week Plan (2027)
An 8-week SRE interview study plan: Linux, SLOs and error budgets, monitoring, incidents, automation, Kubernetes and design, with 24 self-check questions.

An SRE interview preparation plan should cover five areas in order: Linux and networking basics, SLOs and error budgets, monitoring and alerting, incident response, and system design for reliability, with coding practice running alongside. Eight weeks at about ten hours a week is enough for most engineers who already work in operations or development.
This page is a study plan, not a question bank. Each week lists what to study, what to build and a few practice questions with model answers (24 in total) so you can check yourself. When you finish a week, test yourself against the question banks: the 100+ SRE interview questions (the main list), most asked SRE questions for freshers, scenario-based SRE questions and advanced SRE questions for experienced engineers. If you are new to the role itself, read the role of SREs in DevOps teams first.
Key takeaways
- Study in a fixed order: foundations, SLOs, monitoring, incidents, design, then mock interviews. Later topics depend on earlier ones.
- The free Google books at sre.google (Site Reliability Engineering and The Site Reliability Workbook) are the shared vocabulary most interviewers use.
- Be able to do error budget arithmetic in your head: 99.9% over 30 days allows 43.2 minutes of downtime.
- Build one small service with metrics, an SLO, an alert and a runbook. You will draw on it in almost every round.
- Practise speaking. Most SRE loops include a troubleshooting round and a design round where your reasoning is scored as much as the answer.
The eight-week plan at a glance
| Week | Topic | Build or do | Self-check |
|---|---|---|---|
| 1 | Linux, processes, networking | Debug a slow host with standard tools | Questions 1 to 4 |
| 2 | SLIs, SLOs, error budgets | Write SLOs for one service | Questions 5 to 8 |
| 3 | Monitoring and alerting | Prometheus, Grafana and one burn-rate alert | Questions 9 to 12 |
| 4 | Incident response and postmortems | Run a game day, write a postmortem | Questions 13 to 16 |
| 5 | Automation and toil | Automate one manual task, add it to CI | Questions 17 to 18 |
| 6 | Kubernetes and cloud reliability | Deploy with probes, limits and a rollout | Questions 19 to 20 |
| 7 | System design for reliability | Design two systems on paper, out loud | Questions 21 to 24 |
| 8 | Mock interviews and review | Three timed mocks, fix weak areas | Use the question banks linked above |
Coding runs every week: 30 to 45 minutes a day on scripting problems in Python or Go (parsing logs, calling APIs, working with files and strings). SRE coding rounds usually test practical scripting more than advanced algorithms, but check the format with your recruiter.
Week 1: Linux and networking foundations
Study processes and signals, file descriptors, memory (including the page cache and the OOM killer), disk I/O, systemd, and the TCP/IP basics: DNS resolution, the TCP handshake, TLS, HTTP status codes and load balancing. Practise with top, ps, ss, df, du, iostat, vmstat, journalctl, dig, curl -v and strace.
uptime                    # load averages
vmstat 1 5                # run queue, swap, CPU wait
iostat -xz 1 3            # per-disk utilisation and latency
ss -s                     # socket summary
dig +trace example.com    # walk DNS resolution
1. A server's load average is high but CPU use is low. What could it be?
On Linux, load average counts processes waiting on CPU and those in uninterruptible sleep, which is usually disk or network storage I/O. Check vmstat for I/O wait and blocked processes and iostat for disk latency.
2. A disk shows full in df but du finds far less data. Why?
A process is holding a deleted file open, so the space is not released. Find it with lsof +L1 (or lsof | grep deleted) and restart or signal the process. Log rotation without a reload is a common cause.
3. What happens when you type a URL into a browser and press Enter?
DNS resolves the name, the client opens a TCP connection (or QUIC for HTTP/3), negotiates TLS, sends the HTTP request, and a load balancer routes it to a backend that builds the response. Interviewers use this to see how deep you can go at any layer, so be ready to expand on DNS caching, TLS certificates or load balancer health checks.
4. How do you find which process is listening on port 8080?
Run ss -ltnp | grep 8080 (or lsof -i :8080). The -p option shows the process and needs root to show other users' processes.
Week 2: SLIs, SLOs and error budgets
Read the chapters on embracing risk and service level objectives in the Google SRE book, and the implementing SLOs chapter in the workbook. Then write SLOs for a real or sample service: pick SLIs (availability, latency), set targets and compute the error budget. Our posts on error budgets and who defines them help here.
| SLO (30 days) | Allowed bad time | Allowed failed requests per million |
|---|---|---|
| 99% | 7.2 hours | 10,000 |
| 99.5% | 3.6 hours | 5,000 |
| 99.9% | 43.2 minutes | 1,000 |
| 99.95% | 21.6 minutes | 500 |
| 99.99% | 4.32 minutes | 100 |
5. What is the difference between an SLI, an SLO and an SLA?
An SLI is a measurement, such as the share of requests served successfully. An SLO is the target for that measurement over a window, such as 99.9% over 30 days. An SLA is a contract with customers that names consequences if a promised level is missed, and its targets are usually looser than the internal SLO.
6. Why not aim for 100% availability?
Users cannot tell the difference above a point because their own networks and devices fail more often, and every extra nine costs much more effort and slows releases. An SLO below 100% creates an error budget the team can spend on change.
7. What happens when the error budget is used up?
The team follows its agreed error budget policy. Typically, risky releases pause and engineering time shifts to reliability work until the service is back within its SLO. The policy should be agreed with product owners in advance, not invented during an outage.
8. How would you choose SLIs for a checkout API?
Measure what users feel: the ratio of successful checkout requests to valid requests, and the share completed under a latency threshold (for example 95% under 500 ms). Measure as close to the user as practical, such as at the load balancer, and exclude requests that fail because of client errors.
Week 3: Monitoring and alerting
Read the monitoring distributed systems chapter of the SRE book and the alerting on SLOs chapter of the workbook. Set up Prometheus and Grafana for your sample service, expose metrics, build a dashboard and write one alert based on error budget burn rate. Our guide to using Prometheus and Grafana together walks through the setup.
groups:
- name: checkout-slo
  rules:
  - alert: CheckoutErrorBudgetFastBurn
    expr: |
      (
        sum(rate(http_requests_total{job="checkout",code=~"5.."}[1h]))
        /
        sum(rate(http_requests_total{job="checkout"}[1h]))
      ) > (14.4 * 0.001)
    for: 2m
    labels:
      severity: page
A burn rate of 14.4 against a 99.9% SLO spends about 2% of a 30-day budget in one hour, which is the fast-burn page used as an example in the workbook. The workbook also pairs a long window with a short one to cut false alerts; add that once the basic version works.
9. What are the four golden signals?
Latency, traffic, errors and saturation, as described in the Google SRE book. If you can only measure four things for a user-facing system, measure these.
10. Why alert on symptoms instead of causes?
Users feel symptoms such as errors and slow responses. A high CPU alert may not affect anyone, while a symptom alert always does. Cause-based signals belong on dashboards to speed up diagnosis, not in pages.
11. What makes an alert worth paging someone at night?
It needs urgent human action, it reflects real or imminent user impact, and it has a clear runbook. If an alert is regularly acknowledged and ignored, change it to a ticket, fix its threshold or delete it.
12. What is the difference between monitoring and observability?
Monitoring checks known conditions with predefined metrics and alerts. Observability is the ability to ask new questions of the system from its outputs (metrics, logs, traces) when an unknown problem appears. In interviews, give an example of a question you answered with traces that a dashboard could not.
Week 4: Incident response and postmortems
Read the chapters on managing incidents and postmortem culture. Learn the roles (incident commander, operations lead, communications lead), how to declare an incident, and how to write a blameless postmortem. Run a small game day on your sample service: kill a pod, fill a disk, add latency, and time how long detection and recovery take. See also the incident commander role and blameless postmortems.
13. You are paged for a spike in 500 errors. What are your first five minutes?
Acknowledge, check the scope (which service, region and share of users), and look for recent changes such as deploys or config pushes. If a change lines up with the start, roll it back first and investigate later. Open an incident channel and post a short status so others do not duplicate work.
14. Why mitigate before finding the root cause?
Users care about the service working again. Rolling back, failing over or shedding load often restores service in minutes, while root cause analysis can take hours. Capture evidence (logs, graphs, versions) before you change things so the later analysis is still possible.
15. What goes into a blameless postmortem?
Summary, impact, timeline, root cause and contributing factors, what went well, what went badly, where the team got lucky, and action items with owners and due dates. It describes system and process failures, not personal blame.
16. What are MTTD and MTTR, and how do you improve them?
Mean time to detect and mean time to restore (or recover). Improve detection with symptom-based SLO alerts. Improve recovery with fast rollbacks, feature flags, runbooks and practice. Our post on time to restore service covers the metric.
Week 5: Automation and toil
Read the eliminating toil chapter. List the manual tasks in your current job, estimate their time, and automate one with a script that runs in CI or on a schedule. Learn enough Terraform or Ansible to explain how infrastructure as code reduces drift and repeat work.
17. What is toil?
The Google SRE book describes toil as manual, repetitive, automatable work with no lasting value that grows as the service grows. Google's guideline is to keep it under half of an SRE's time so there is room for engineering work.
18. How do you decide what to automate first?
Rank tasks by how often they happen, how long they take and how risky a manual mistake is. Automate frequent, error-prone tasks first, and make sure the automation is tested, logged and safe to rerun.
Week 6: Kubernetes and cloud reliability
Deploy your sample service to a local Kubernetes cluster with readiness and liveness probes, resource requests and limits, a PodDisruptionBudget and a rolling update. Learn what happens on node failure and how autoscaling works. Our Kubernetes architecture components post is a quick refresher.
19. What is the difference between readiness and liveness probes?
A failed readiness probe removes the pod from service endpoints so it gets no traffic. A failed liveness probe makes the kubelet restart the container. Point liveness at a cheap check, because a liveness probe that depends on a database can restart every pod during a database blip.
20. How do you design for a cloud availability zone failure?
Run replicas across at least two zones, with load balancers and data stores configured for multi-zone operation, and keep enough spare capacity to absorb the loss of a zone. Test it by draining one zone in a game day.
Week 7: System design for reliability
Practise designing two or three systems out loud, such as a URL shortener, a notification service and a metrics pipeline. For each one, cover requirements, an SLO, the request path, data storage, scaling, failure modes and how you would monitor it. Read the chapters on handling overload and addressing cascading failures.
21. How do you stop one slow dependency from taking down your service?
Set timeouts on every call, retry with backoff and jitter only for safe operations, limit concurrency with bulkheads, and use circuit breakers so you fail fast. Serve degraded responses (cached data, hidden features) instead of failing the whole page.
22. What causes a retry storm, and how do you prevent it?
When a service slows down, clients time out and retry, multiplying load on a system that is already struggling. Prevent it with retry budgets, exponential backoff with jitter, retries at only one layer of the stack, and load shedding at the server.
23. How do you plan capacity for a launch?
Estimate peak demand from business forecasts and past patterns, load test to find the limit of each component, and provision headroom above the expected peak. Add autoscaling with limits, prepare a degrade plan, and watch saturation metrics during the launch.
24. How do you deploy safely to a large fleet?
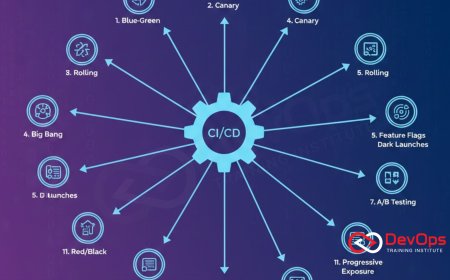
Use progressive delivery: canary to a small share of traffic, compare SLIs against the baseline, then widen in stages with automatic rollback on regression. Keep releases small and reversible, and separate config pushes from code pushes.
Week 8: Mock interviews and review
- Do three timed mocks with a friend or colleague: one troubleshooting, one design, one behavioral.
- For behavioral rounds, prepare short stories about an incident you handled, a time you reduced toil, and a disagreement about reliability vs features. Use real events only.
- Go through the 100+ SRE question bank and mark every question you cannot answer in two minutes. Revisit those topics.
- Rehearse explaining your sample service: its SLO, its alert, its runbook and the game day results.
Adjusting the plan for your background
| Background | Spend more time on | Can move faster through |
|---|---|---|
| System administrator | Coding, system design | Linux and networking |
| Software developer | Linux, networking, incident response | Coding |
| DevOps engineer | SLOs, error budgets, design | CI/CD, Kubernetes basics |
| Fresher | Linux, networking, one cloud | Nothing; extend to 12 weeks |
If you want a structured version of this plan with labs and mentors, our DevOps training and Prometheus and Grafana training are available in our Kharadi, Pune classroom and live online.
Frequently asked questions
How long does it take to prepare for an SRE interview?
About eight weeks at ten hours a week works for most people who already work in operations or development. Freshers should plan for around twelve weeks and spend extra time on Linux, networking and one cloud platform.
What should I study first for an SRE interview?
Start with Linux and networking basics, then SLIs, SLOs and error budgets. Monitoring, incident response and system design all build on those two areas.
Which books are best for SRE interview preparation?
Google's Site Reliability Engineering and The Site Reliability Workbook, both free to read at sre.google, are the most common shared reference. Add a Linux performance book or course if troubleshooting is a weak area.
How much coding is in an SRE interview?
Most SRE loops include at least one coding round, usually practical scripting in Python or Go such as parsing logs or calling APIs. Ask your recruiter about the format, because it varies by company.
How do I calculate an error budget?
Subtract the SLO from 100% and apply it to the window. For 99.9% over 30 days, the budget is 0.1% of 43,200 minutes, which is 43.2 minutes, or 1,000 failed requests per million.
Is this page a list of SRE interview questions?
It is a study plan with 24 practice questions for self-checks. For full question lists, use the 100+ SRE questions guide, the scenario-based guide and the advanced guide linked at the top of the page.
Do I need a certification to get an SRE job?
No certification is required by most employers, though cloud or Kubernetes certifications can help show baseline skills. Hands-on evidence, such as a service you monitored with SLOs and a postmortem you wrote, carries more weight in interviews.
References
What's Your Reaction?
 Like
0
 Dislike
0
 Love
0
 Funny
0
 Angry
0
 Sad
0
 Wow
0