


![Kong Interview Preparation Guide [2025]](https://www.devopstraininginstitute.com/blog/uploads/images/202509/image_430x256_68dbb95326997.jpg)


Monitoring Tools in DevOps – Best Training in Bangalore
Explore essential monitoring tools in DevOps like Prometheus, Grafana, ELK Stack, Nagios, and Splunk, and find the best training in Bangalore for 2025. This guide covers tool overviews, hands-on courses with live projects, certification prep, and top institutes offering flexible batches and 90%+ placements. With fees from INR 25,000 to 50,000, master observability for CI/CD pipelines and cloud environments. Ideal for beginners and pros aiming to boost reliability and career growth in Bangalore's IT hub.
Introduction
In DevOps, monitoring is the backbone of reliable systems. It involves tracking metrics, logs, and traces to ensure applications run smoothly, detect issues early, and maintain performance. Tools like Prometheus for metrics and Grafana for visualization turn raw data into actionable insights, enabling teams to automate alerts and optimize CI/CD pipelines.
Bangalore, as India's tech epicenter, offers world-class training for these tools. With a surge in cloud-native adoption, demand for skilled monitoring experts is at an all-time high in 2025. This blog breaks down key monitoring tools, their roles in DevOps, and the best institutes providing practical courses. You'll get step-by-step learning paths, syllabus details, fees, and placement tips to kickstart your journey.
Whether you're troubleshooting Kubernetes clusters or setting up log analytics, mastering these tools can elevate your career. Institutes like DevOps Training Institute integrate monitoring into comprehensive DevOps programs, blending theory with real-world labs. Let's uncover how to stay ahead in observability.
Why Monitoring Matters in DevOps
Monitoring provides visibility into infrastructure and applications, aligning with DevOps principles of continuous feedback and improvement. It helps identify bottlenecks, predict failures, and ensure compliance, reducing downtime by up to 50% in agile environments.
Key Benefits
Proactive alerting prevents outages, while analytics optimize resource use. In cloud setups like AWS or Azure, monitoring integrates with IaC for automated scaling.
- Enhances collaboration: Shared dashboards for dev and ops teams.
- Supports scalability: Handles microservices and containerized apps.
- Drives efficiency: Real-time insights cut mean time to resolution (MTTR).
Bangalore's training programs emphasize these, preparing you for roles in high-stakes IT firms.
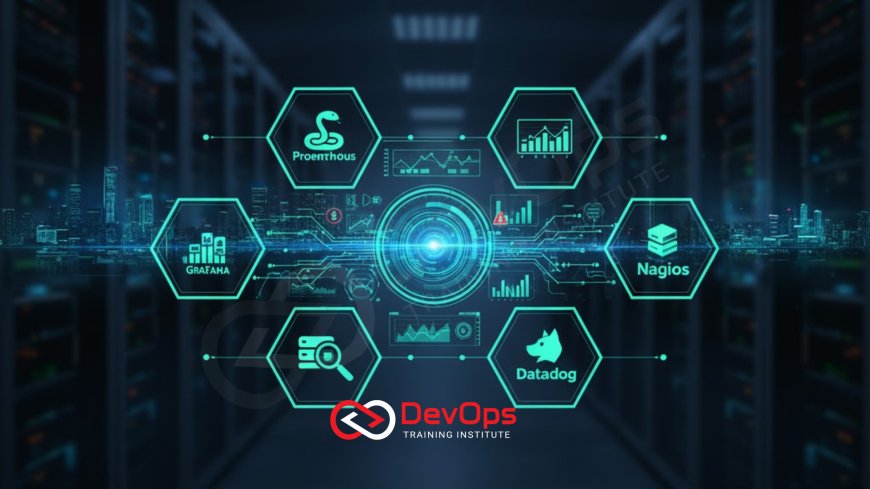
Top Monitoring Tools in DevOps
DevOps monitoring stacks vary by needs: open-source for flexibility, commercial for enterprise features. Here's a rundown of essentials.
Prometheus: Metrics Collection Leader
Prometheus excels in time-series data for cloud-native environments, pulling metrics via exporters and querying with PromQL. Ideal for Kubernetes monitoring.
Grafana: Visualization Powerhouse
Grafana creates interactive dashboards from multiple sources like Prometheus or Elasticsearch. Its alerting and plugins make it versatile for observability.
ELK Stack: Log Management Essential
Elasticsearch stores logs, Logstash processes them, and Kibana visualizes. Perfect for searching vast data in distributed systems.
Nagios: Reliable Infrastructure Watchdog
Nagios offers plugin-based checks for hosts and services, with strong alerting. It's battle-tested for network monitoring.
Splunk: Enterprise Analytics
Splunk handles logs, metrics, and security events with machine learning for anomaly detection. Suited for large-scale compliance needs.
For a quick comparison:
| Tool | Focus | Open Source | Best For | Integration |
|---|---|---|---|---|
| Prometheus | Metrics | Yes | Kubernetes | Grafana, Alertmanager |
| Grafana | Dashboards | Yes | Visualization | Prometheus, ELK |
| ELK Stack | Logs | Yes | Search/Analysis | Beats, Logstash |
| Nagios | Infrastructure | Yes | Networks | Plugins, NRPE |
| Splunk | Analytics | No | Enterprise | ML, Security |
Choose based on scale; open-source stacks like Prometheus-Grafana are popular for cost-effectiveness. Dive into their Linux roots for better setup.
Building a Monitoring Stack: Step-by-Step
Start simple: Install Prometheus for metrics, then layer Grafana. Integrate ELK for logs and Nagios for alerts.
Step 1: Metrics with Prometheus
Deploy via Helm in Kubernetes: helm install prometheus prometheus-community/prometheus. Configure scrape jobs for nodes.
Step 2: Visualize with Grafana
Add Prometheus as datasource, import dashboards for CPU/memory trends.
Step 3: Logs via ELK
Set up Filebeat to ship logs to Logstash, index in Elasticsearch, query in Kibana.
- Alerting: Use Alertmanager for notifications.
- Testing: Simulate loads to validate.
- Scaling: Federation for multi-cluster.
Advanced: Add Splunk for AI-driven insights.
Best Training Institutes in Bangalore for Monitoring Tools
Bangalore's institutes offer specialized modules on these tools within DevOps courses. Focus on hands-on labs with AWS integrations.
| Institute | Duration | Fees (INR) | Key Tools Covered | Placement Rate |
|---|---|---|---|---|
| DevOps Training Institute | 80 days | 52,000 | Prometheus, Grafana, ELK | 94% |
| WebAsha Technologies | 90 days | 48,000 | Nagios, Splunk, Loki | 96% |
| Linux Training Institute | 70 days | 38,000 | Basic Prometheus, Nagios | 88% |
| Python Training Institute | 60 days | 35,000 | Scripting for ELK, Grafana | 85% |
| Cyber Security Training Institute | 75 days | 45,000 | Splunk Security, DevSecOps Monitoring | 90% |
Programs include mock alerts and dashboard projects. See how open source drives these tools.
Syllabus Overview: What to Expect
Courses dedicate 20-30% to monitoring, with labs on setup and troubleshooting. Core: Metrics collection, log parsing, alerting rules.
Typical Modules
Week 1: Prometheus installation, exporters. Week 2: Grafana dashboards, queries. Week 3: ELK pipeline, Kibana searches. Week 4: Nagios plugins, Splunk queries.
- Projects: Monitor a Jenkins pipeline.
- Advanced: Integrate with Kubernetes.
- Assessments: Build custom alert systems.
Ethical Hacking Training Institute focuses on secure monitoring practices.
Fees, Certifications, and Placement Guidance
Fees range INR 25,000-50,000, covering tools access and cert prep. Certifications: CNCF Prometheus, Splunk Fundamentals.
Cost Insights
Basic: INR 25,000 (open-source focus). Full: INR 45,000 (with enterprise tools). Placements: Mock interviews, 85-96% success.
- ROI: Boost salary by 25% post-cert.
- Options: Weekend batches, EMI.
- Support: LinkedIn networking groups.
Linux Training Institute offers affordable entry. Learn why Linux is preferred for monitoring.
Career Paths and Opportunities
Skills lead to Site Reliability Engineer (INR 12-20 LPA) or Observability Specialist roles. Bangalore's market: 400+ openings monthly.
Job Essentials
Hirers: Accenture, IBM. Advance with multi-tool expertise.
- Entry: Monitoring Analyst (INR 8 LPA).
- Mid: DevOps Monitor Lead (INR 16 LPA).
- Growth: Freelance consulting.
WebAsha Technologies aids with 96% placements. Compare distros for tool hosting.
Conclusion
Monitoring tools like Prometheus and Grafana are indispensable in DevOps, providing the insights needed for resilient systems. Bangalore's top institutes, including DevOps Training Institute and WebAsha Technologies, deliver expert training with practical focus, ensuring you're equipped for 2025's demands. With affordable fees and strong placements, invest now to master observability and advance your career in this thriving tech city.
Frequently Asked Questions
What are the top monitoring tools for DevOps beginners?
Start with Prometheus for metrics and Grafana for dashboards; they're open-source and easy to integrate.
How much does monitoring training cost in Bangalore?
INR 25,000 to 50,000, depending on institute and inclusions like certifications.
Is prior DevOps experience needed?
No, beginner courses cover basics; advanced ones suit those with CI/CD knowledge.
What certifications can I get?
CNCF Prometheus Certified Associate, Splunk User, or ELK-focused badges.
Do courses include hands-on projects?
Yes, like setting up Grafana alerts for a Kubernetes cluster.
Are weekend batches available?
Most institutes, including WebAsha Technologies, offer flexible schedules.
How does ELK differ from Splunk?
ELK is open-source for logs; Splunk adds AI analytics for enterprises.
What salary after training?
INR 10-18 LPA starting, higher with certifications in Bangalore.
Can I learn online?
Hybrid options at DevOps Training Institute with live labs.
Why focus on Prometheus-Grafana?
They're standard for cloud-native monitoring, per industry trends.
Do programs cover security monitoring?
Cyber Security Training Institute includes DevSecOps with tools like Splunk.
How long are courses?
60-90 days, with modular monitoring sections.
What projects are typical?
Building a full stack: Prometheus metrics to Grafana dashboard.
Is Nagios still relevant?
Yes, for legacy infrastructure checks.
Why Bangalore for training?
Tech hub with MNC ties, affordable, and high job density.
What's Your Reaction?
 Like
0
Like
0
 Dislike
0
Dislike
0
 Love
0
Love
0
 Funny
0
Funny
0
 Angry
0
Angry
0
 Sad
0
Sad
0
 Wow
0
Wow
0
![100+ Azure DevOps Interview Questions and Answers [Updated 2025]](https://www.devopstraininginstitute.com/blog/uploads/images/202509/image_140x98_68c40aa9a3834.jpg)


![Future Scope of DevOps Careers in Pune [Updated 2025]](https://www.devopstraininginstitute.com/blog/uploads/images/202510/image_140x98_68e3a84652312.jpg)


