Observability Tools in DevOps – Learn in Bangalore
Master observability tools in DevOps with Bangalore’s best hands-on training at WebAsha Technologies and DevOps Training Institute. Learn Prometheus, Grafana, Loki, Jaeger, OpenTelemetry, ELK Stack, Datadog, and more through real microservices projects. Build production-grade monitoring, tracing, and logging systems with 100% placement support and live cloud labs in Bangalore.
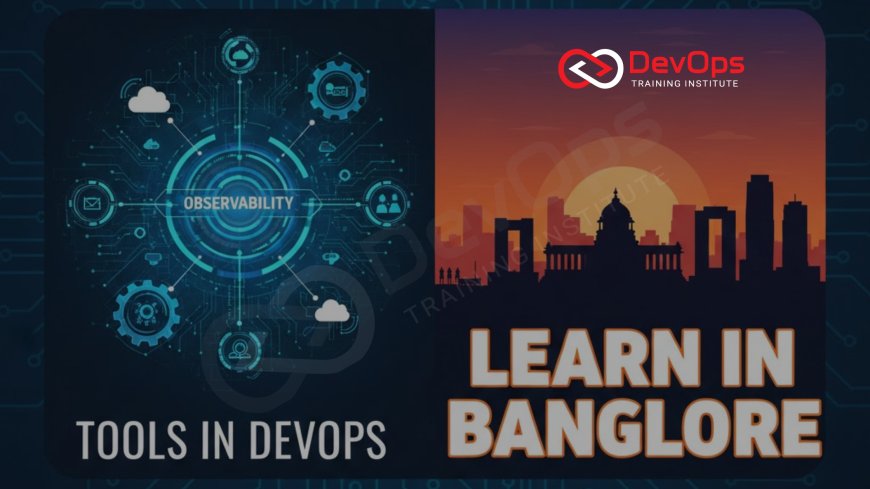
Introduction
Observability has become the cornerstone of modern DevOps and Site Reliability Engineering. In complex microservices and cloud-native environments, traditional monitoring is no longer enough; you need full visibility into logs, metrics, and traces to detect, debug, and prevent issues before they impact users. Bangalore, home to India’s largest cloud-native companies, offers world-class training in observability tools through institutes like WebAsha Technologies and DevOps Training Institute. This specialized course teaches you to build complete observability platforms using open-source and enterprise tools with real-world projects.
- Understand the three pillars: Metrics, Logs, and Traces
- Deploy and operate Prometheus + Grafana at scale
- Implement distributed tracing with Jaeger and OpenTelemetry
- Centralize logs using Loki and ELK Stack
- Build SLOs, SLIs, and alerting based on user experience
- Work on live microservices running on Kubernetes
- Get placed in SRE, DevOps, and Platform Engineering roles
Bangalore companies pay premium salaries for strong observability skills.
This training turns you into a production-ready observability engineer.
Why Observability is Critical in Modern DevOps
In distributed systems, failures are normal. Observability gives you the superpower to answer “Why is this happening?” instead of just “What is happening?”
- Reduce MTTD (Mean Time To Detection) from hours to minutes
- Shorten MTTR (Mean Time To Resolution) dramatically
- Prevent outages using anomaly detection and predictive alerts
- Measure user happiness with Golden Signals and RED method
- Support thousands of microservices without blind spots
- Enable blameless postmortems with full context
- Meet strict SLAs in fintech, e-commerce, and healthcare
Every major Bangalore company runs large-scale observability platforms.
Observability engineers are among the highest-paid DevOps professionals.
Core Observability Tools You Will Master
Bangalore’s top courses cover both open-source and commercial tools used in real enterprises.
| Pillar | Primary Tools | Use Case |
|---|---|---|
| Metrics | Prometheus, Grafana, Cortex | Time-series monitoring & dashboards |
| Logs | Loki, ELK (Elasticsearch, Logstash, Kibana), Fluent Bit | Log aggregation & search |
| Traces | Jaeger, Tempo, OpenTelemetry, Zipkin | Distributed tracing & latency analysis |
| Enterprise | Datadog, New Relic, Dynatrace | Unified commercial platforms |
- OpenTelemetry as the universal instrumentation standard
- Service mesh integration (Istio, Linkerd) for auto-instrumentation
- Alerting with Alertmanager and PagerDuty
You install and operate every tool from scratch.
Real Kubernetes clusters are used throughout training.
Hands-On Project: Full Observability Platform for Microservices
You build and operate a complete observability stack monitoring a real e-commerce application.
- Instrument Node.js, Python, and Java services with OpenTelemetry
- Deploy Prometheus with remote write to Cortex for long-term storage
- Set up Grafana with pre-built dashboards and alerting rules
- Configure Loki + Promtail for log collection from Kubernetes pods
- Enable distributed tracing with Jaeger and trace-based alerts
- Create service-level objectives (SLOs) using error budgets
- Simulate failures and practice incident response
Your final dashboard is live and accessible 24/7.
This project becomes the crown jewel of your portfolio.
Advanced Topics Covered in Bangalore Training
Go beyond basics with enterprise-grade patterns. Understanding scalability is key when designing observability systems for large deployments.
- High-cardinality metrics handling with Prometheus
- Multi-tenant Grafana with role-based access
- Log sampling and retention policies at scale
- Trace sampling strategies for cost control
- Correlation between metrics, logs, and traces in one click
- AI-powered anomaly detection with Grafana Machine Learning
- Exporting data to Snowflake/BigQuery for business analytics
Students learn patterns used by Flipkart, Swiggy, and PhonePe.
Production readiness is the focus from day one.
Service Level Objectives (SLOs) and Error Budgets
Observability without SLOs is just pretty dashboards. Bangalore courses teach Google SRE practices end-to-end.
- Define meaningful SLIs from user journeys
- Set realistic SLOs (99.9%, 99.95%, etc.)
- Calculate and track error budgets in real time
- Implement budget-based release gates in CI/CD
- Build burn-rate alerts using PromQL
- Conduct blameless postmortems with full context
You implement SLOs for your capstone project.
This is what separates junior engineers from senior SREs.
Why Bangalore is the Best Place to Learn Observability
Bangalore companies run some of the largest observability platforms in India. Local institutes have direct insight into real requirements.
- Trainers are SREs from top product companies
- Live clusters with 100+ microservices for practice
- Guest lectures from Datadog, Grafana Labs, and Elastic engineers
- Direct placements into observability teams
- Weekend and online batches available
- 100% job assistance with mock SRE interviews
Highest demand and salaries for observability skills in India.
Bangalore remains unmatched for SRE and DevOps training.
Career Opportunities After Observability Training
Companies are desperate for engineers who truly understand observability.
- Roles: SRE, Observability Engineer, Platform Engineer, DevOps Engineer
- Average fresher salary: 12–20 LPA
- Experienced: 25–60 LPA
- Top recruiters: Google, Microsoft, Flipkart, Atlassian, Intuit, Zepto
- Many students clear CKA, CKS, and professional cloud certifications
- Global remote roles widely available
Observability experts are always the first to get promoted.
Your skills remain relevant for the next decade.
Conclusion
Observability is no longer optional; it is the difference between reactive firefighting and proactive reliability. Bangalore offers the most comprehensive, hands-on observability training in India at institutes like WebAsha Technologies and DevOps Training Institute. With real microservices, production-grade tools, and direct placement support, this course transforms you into a sought-after SRE or observability engineer. Enroll today and gain the skills that power India’s most reliable digital platforms.
Frequently Asked Questions
What is the difference between monitoring and observability?
Monitoring tells you what is wrong. Observability lets you ask why it’s wrong in unknown scenarios.
Which is the best observability stack in 2025?
OpenTelemetry + Prometheus + Grafana + Loki + Jaeger is the leading open-source stack.
Do I need Kubernetes knowledge?
Basic Kubernetes is taught, but prior exposure helps.
How long is the observability course?
2–4 months depending on weekend or fast-track batch.
Will I work on real applications?
Yes, you monitor live microservices deployed on actual clusters.
Is this course for beginners?
Beginners with basic Linux and DevOps knowledge can join.
Are online classes available?
Yes, live online training with full lab access.
Do you provide placement help?
100% placement assistance with direct company tie-ups.
Which companies hire observability engineers?
Google, Microsoft, Flipkart, Swiggy, Atlassian, and 300+ others.
Will I learn OpenTelemetry?
Yes, full instrumentation in multiple languages is covered.
Is Grafana certification included?
Training aligns with Grafana certification objectives.
Can I pay in installments?
Zero-cost EMI options available.
Are recordings provided?
Yes, lifetime access to all sessions and labs.
What salary can I expect?
Freshers: 12–20 LPA, experienced: 25–60 LPA in Bangalore.
How do I enroll?
Book a free demo class or contact the institute directly.
What's Your Reaction?
 Like
0
 Dislike
0
 Love
0
 Funny
0
 Angry
0
 Sad
0
Sad
0
 Wow
0
Wow
0


![Kong Interview Preparation Guide [2025]](https://www.devopstraininginstitute.com/blog/uploads/images/202509/image_430x256_68dbb95326997.jpg)



![100+ Azure DevOps Interview Questions and Answers [Updated 2025]](https://www.devopstraininginstitute.com/blog/uploads/images/202509/image_140x98_68c40aa9a3834.jpg)


![90+ Git and GitHub Interview Questions [2025]](https://www.devopstraininginstitute.com/blog/uploads/images/202509/image_140x98_68c40a7931d60.jpg)


![Future Scope of DevOps Careers in Pune [Updated 2025]](https://www.devopstraininginstitute.com/blog/uploads/images/202510/image_140x98_68e3a84652312.jpg)


