What Are the Differences Between CloudWatch and Prometheus for Monitoring?
Choosing the right monitoring solution is crucial for any modern tech stack. Dive into a comprehensive comparison of AWS CloudWatch and Prometheus to understand their core differences. This guide breaks down their architectures, contrasting CloudWatch's managed, push-based model with Prometheus's open-source, pull-based system. Learn which platform is best for your environment, whether you're building on an AWS-native stack or deploying a multi-cloud strategy with Kubernetes. We'll explore their respective strengths, from CloudWatch's deep AWS integration to Prometheus's powerful PromQL query language and vast ecosystem. Make an informed decision for your monitoring needs and ensure your infrastructure is scalable and resilient.

Table of Contents
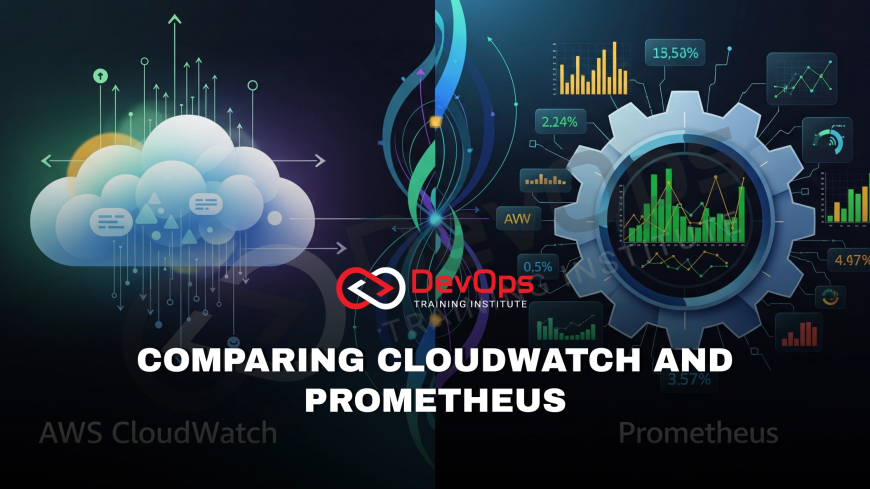
In the world of modern cloud computing, monitoring is essential for maintaining the health and performance of applications. Two of the most prominent solutions in this space are AWS CloudWatch and Prometheus. While both are powerful tools designed to collect and analyze metrics, they operate on fundamentally different principles. CloudWatch is a fully managed, AWS-native service, deeply integrated into the Amazon ecosystem. In contrast, Prometheus is an open-source, self-hosted system favored in multi-cloud and Kubernetes environments. Understanding the core differences in their architecture and approach is critical for choosing the right solution for your specific infrastructure and operational needs.
What is CloudWatch and how is it different from Prometheus?
Amazon CloudWatch is a managed monitoring and observability service that is a native part of the AWS platform. It automatically collects metrics, logs, and events from all AWS resources, giving you a unified view of your entire infrastructure. Because it's a managed service, there is no need to set up or maintain any underlying servers. In contrast, Prometheus is an open-source monitoring solution and time-series database. It is not tied to a single cloud provider and must be deployed and managed by the user. Its flexibility and powerful query language, PromQL, have made it the de-facto standard for monitoring containerized applications, especially those running on Kubernetes.
Why are their data collection models so different?
A key architectural difference lies in their data collection models. CloudWatch operates on a push model. In this model, AWS services automatically send their metrics and logs to the CloudWatch service. For custom metrics, you must use an SDK or an agent to push data to the service. This model simplifies setup for native AWS resources but offers less granular control over collection frequency. On the other hand, Prometheus uses a pull model. A Prometheus server actively "scrapes" or pulls metrics from configured targets at a specified interval. This gives you fine-grained control over what data is collected and from where, making it highly customizable for diverse environments beyond just AWS.
How do their ecosystems and features compare?
The ecosystems surrounding these tools are vastly different. CloudWatch is a comprehensive platform that includes CloudWatch Logs for log aggregation and CloudWatch Events for event-driven automation. Its alerting system is straightforward and can be integrated with other AWS services like SNS and Auto Scaling. Prometheus, being open-source, has a massive community-driven ecosystem. The powerful PromQL query language is a core feature, enabling complex data analysis. Its alerting is handled by a separate component called the Alertmanager, which offers advanced routing and grouping. A wide range of community-developed "exporters" also exist to collect metrics from virtually any third-party application or server.
CloudWatch vs. Prometheus: A Comparison Table
The following table provides a high-level comparison of the key features and characteristics of AWS CloudWatch and Prometheus, highlighting their core differences for monitoring.
Feature Comparison
| Feature | AWS CloudWatch | Prometheus |
|---|---|---|
| Architecture | Fully managed service, native to AWS. | Self-hosted, open-source software. |
| Data Collection | Push model (metrics sent to the service). | Pull model (server scrapes metrics from targets). |
| Best for | AWS-exclusive or heavily integrated workloads. | Multi-cloud, hybrid, or Kubernetes environments. |
| Query Language | Metrics Insights (SQL-like), Metric Math. | PromQL (powerful and purpose-built). |
| Cost Model | Pay-per-use (metrics, logs, alarms). | Free software, but you pay for the infrastructure to run it. |
| Alerting | Integrated CloudWatch Alarms. | Separate Alertmanager component. |
| Ecosystem | Deep integration with other AWS services. | Vast, community-driven ecosystem of exporters. |
Conclusion
Choosing between CloudWatch and Prometheus boils down to your infrastructure and operational philosophy. If you are deeply invested in the AWS ecosystem and prefer a hands-off, managed solution, CloudWatch is the ideal choice. Its seamless integration and low maintenance make it perfect for AWS-native applications. However, if your environment spans multiple clouds, includes on-premises infrastructure, or is heavily based on Kubernetes, Prometheus offers the flexibility, control, and powerful querying capabilities needed for complex, cloud-native architectures. Its open-source nature and robust community ecosystem provide a customizable and powerful monitoring backbone that is not tied to any single vendor.
Frequently Asked Questions
What is a time-series database?
A time-series database (TSDB) is a database optimized for handling data points with a timestamp. Both CloudWatch and Prometheus use a TSDB to store and query metrics, which are data points collected at regular intervals over time.
What is the difference between a push and pull model?
In a push model, the monitored target sends data to the monitoring system. In a pull model, the monitoring system requests and retrieves data from the target. CloudWatch uses push, while Prometheus uses pull.
What is PromQL?
PromQL is the powerful query language used by Prometheus. It is designed to work with its multi-dimensional data model, allowing users to select, filter, and aggregate time-series data for analysis and alerting.
What are CloudWatch Alarms?
CloudWatch Alarms monitor a single metric over a specified period. When the metric breaches a threshold, the alarm triggers and can send a notification or automatically initiate an action, such as an Auto Scaling policy.
What is an exporter in Prometheus?
An exporter is a small service that runs on a target to expose metrics in a format that Prometheus can scrape. There are many community-built exporters for various technologies, making Prometheus highly extensible.
How does CloudWatch handle logs?
CloudWatch Logs allows you to collect, monitor, store, and access log files from EC2 instances, AWS CloudTrail, and other sources. You can use it to set up metric filters and alarms based on log data.
Is CloudWatch a time-series database?
Yes, CloudWatch uses a time-series database to store and analyze metrics. It provides services for both time-series data and logs, offering a comprehensive observability solution within the AWS ecosystem for monitoring.
Can Prometheus run on AWS?
Yes, Prometheus is cloud-agnostic and can be deployed on AWS. You can run it on an EC2 instance or as a container within a managed Kubernetes service like Amazon EKS, giving you flexibility.
Does Prometheus have a dashboard?
Prometheus has a basic web interface for querying and visualizing metrics. For advanced dashboarding, it's typically used in combination with a tool like Grafana, which has a native data source plugin for Prometheus.
Can CloudWatch monitor on-premises servers?
Yes, you can use the CloudWatch agent to collect metrics and logs from on-premises servers or virtual machines. This allows you to have a single monitoring pane for both your cloud and on-premises resources.
What is a key benefit of a pull model?
A key benefit of the pull model is that you control what is scraped and when. It simplifies configuration for dynamic environments like Kubernetes, where new targets can be discovered and scraped automatically.
What is a key benefit of a push model?
A key benefit of the push model is that it's ideal for transient or batch jobs that may not be available for the monitoring system to scrape. They can simply push their metrics before shutting down.
How does Prometheus handle long-term data storage?
Prometheus's local storage is limited. For long-term data retention, it requires integrating with a separate solution, such as **Thanos** or **Cortex**, to federate data to object storage like Amazon S3.
What is the Prometheus Alertmanager?
The Alertmanager is a separate component of the Prometheus ecosystem that handles alerting logic. It groups similar alerts, deduplicates them, and routes them to different notification integrations like email, Slack, or PagerDuty.
How does CloudWatch cost work?
CloudWatch uses a pay-as-you-go model. You are charged based on the number of custom metrics, log data ingested, and alarms created. The cost can scale with the volume of your infrastructure and monitoring data.
Can CloudWatch be used with Kubernetes?
Yes, you can use the CloudWatch Container Insights feature to monitor containerized applications running on services like Amazon EKS. It automatically collects metrics and logs from your Kubernetes clusters.
What is the best choice for a multi-cloud strategy?
For a multi-cloud strategy, Prometheus is often the better choice. Its open-source and self-hosted nature means it can be deployed consistently across different cloud providers and on-premises environments.
What is the "exporter" for an AWS EC2 instance?
There are a few options. You can use the standard Prometheus Node Exporter to get system-level metrics from the EC2 instance, which would be scraped by the Prometheus server.
How do I monitor AWS services with Prometheus?
You can use an AWS exporter for Prometheus. This tool scrapes metrics from various AWS services via their API and then exposes them as a Prometheus-compatible endpoint to be pulled by a Prometheus server.
Which tool is better for beginners?
For those primarily on AWS, CloudWatch can be easier for beginners due to its managed nature and tight integration with the AWS console. Prometheus has a steeper learning curve with its ecosystem and PromQL.
What's Your Reaction?
 Like
0
 Dislike
0
 Love
0
 Funny
0
 Angry
0
 Sad
0
Sad
0
 Wow
0
Wow
0


![Kong Interview Preparation Guide [2025]](https://www.devopstraininginstitute.com/blog/uploads/images/202509/image_430x256_68dbb95326997.jpg)


![100+ Azure DevOps Interview Questions and Answers [Updated 2025]](https://www.devopstraininginstitute.com/blog/uploads/images/202509/image_140x98_68c40aa9a3834.jpg)


![90+ Git and GitHub Interview Questions [2025]](https://www.devopstraininginstitute.com/blog/uploads/images/202509/image_140x98_68c40a7931d60.jpg)


![Future Scope of DevOps Careers in Pune [Updated 2025]](https://www.devopstraininginstitute.com/blog/uploads/images/202510/image_140x98_68e3a84652312.jpg)


