12 Serverless Monitoring Tools DevOps Should Know
Master the complexities of modern, event-driven applications with the 12 best Serverless Monitoring Tools every DevOps Engineer must know. This comprehensive guide highlights the essential differences between monitoring servers and monitoring ephemeral functions like AWS Lambda and Azure Functions. Discover tools ranging from cloud-native giants like AWS CloudWatch and Azure Monitor to specialized platforms like Datadog, Lumigo, and Thundra, focusing on distributed tracing, cold start analysis, and cost optimization. Mastering this specialized toolset is vital for ensuring reliability, performance, and efficiency in any serverless environment, maintaining robust continuous delivery pipelines for the next generation of cloud applications.
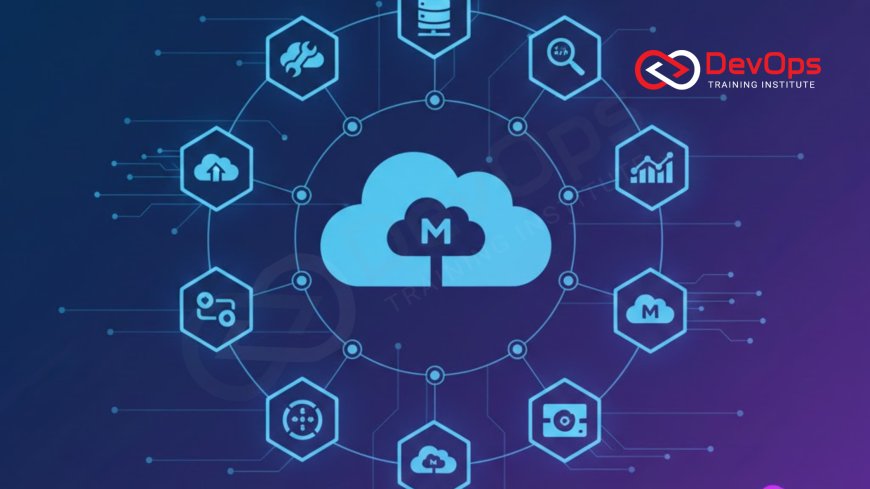
Introduction
The adoption of serverless computing, driven primarily by Function as a Service (FaaS) offerings like AWS Lambda, Azure Functions, and Google Cloud Functions, represents a significant paradigm shift in how applications are built and operated. While serverless architecture drastically reduces operational overhead by eliminating the need to manage infrastructure—abstracting away the virtual machines, operating systems, and resource scaling—it simultaneously introduces profound complexities in the realm of monitoring and observability. The fundamental challenge lies in the ephemeral nature of functions: they execute for mere milliseconds in response to an event, lack persistent connections, and disappear just as quickly as they appear. This means traditional monitoring tools, which rely on persistent agents installed on Linux servers, are no longer effective for diagnosing performance bottlenecks.
For the modern DevOps Engineer, adapting to this environment requires a specialized toolkit designed to handle distributed, event-driven workflows, where applications are composed of dozens or even hundreds of interconnected functions, databases, and message queues. Successfully mastering serverless operations depends entirely on the ability to correlate metrics, logs, and traces across these transient, distributed components, particularly to diagnose the notorious "cold start" issue and ensure consistent end-to-end performance. The following 12 tools are the essential solutions that allow engineers to maintain reliability, optimize costs, and achieve granular visibility into the black box of function execution, ensuring that the promise of serverless agility is met with robust operational control.
The tools chosen must provide distributed tracing to visualize the flow of execution across multiple functions and services, alongside powerful log analysis capabilities to sift through the massive volume of data generated by rapid function invocations. This specialized skillset is paramount for managing the next generation of cloud applications, which run on services designed to be disposable and completely abstracted from the underlying virtualization technology or the Linux kernel itself, creating a new operational challenge for the traditional monitoring stack.
The Native Cloud Essentials
The foundational starting point for serverless monitoring involves leveraging the integrated tools provided by the cloud vendors themselves. These native services offer the deepest, most seamless integration with the FaaS platforms and related services (like message queues and databases), often requiring minimal configuration to begin collecting basic metrics and logs. While they offer deep integration, their primary drawback is a lack of end-to-end visibility across multi-cloud or third-party components, often forcing engineers to rely on additional, specialized tools for true holistic observability across the distributed architecture.
- AWS CloudWatch: The native monitoring and observability service for Amazon Web Services is the absolute default starting point for any application running on AWS Lambda. It automatically collects metrics (invocation count, error rate, duration, throttles) and aggregates function logs via CloudWatch Logs. DevOps Engineers rely on CloudWatch for setting up basic alerts, managing retention policies for logs, and visualizing standard performance indicators, providing essential foundational data required for any serverless deployment running on the AWS cloud.
- AWS X-Ray: X-Ray is AWS's native distributed tracing service. It provides a visual service map that traces the flow of a request as it passes through multiple functions and services (like API Gateway, DynamoDB, and other Lambda functions). This tracing capability is critical for diagnosing latency issues in event-driven serverless architectures, helping engineers pinpoint exactly which component is causing the performance bottleneck or contributing to high execution latency, especially during complex sequential workflows.
- Azure Monitor: The equivalent managed monitoring service for Microsoft Azure environments, Azure Monitor automatically ingests metrics, logs (via Log Analytics), and application traces from Azure Functions. It provides powerful querying capabilities via the Kusto Query Language (KQL) and offers automated insights into application performance and usage. Its native integration is essential for organizations committed to the Azure ecosystem, providing a unified view of the application's health across all Azure services.
- GCP Cloud Operations (Stackdriver): Google Cloud Platform's integrated suite for monitoring, logging, and tracing services. It provides deep visibility into Cloud Functions and related services. Like its counterparts, GCP Cloud Operations aggregates metrics and traces, offering automated anomaly detection and alerting. Its unified approach simplifies operations for those using the Google Cloud ecosystem, helping to maintain service reliability across various geographical regions and services.
Specialized Third-Party Observability Platforms
While cloud-native tools provide the essential raw data, specialized third-party platforms are often necessary for high-scale enterprise applications, multi-cloud strategies, or those requiring advanced features like automated anomaly detection, deeper distributed tracing across hybrid environments, and granular cost analysis. These commercial platforms focus on enhanced developer experience and actionable intelligence, abstracting complexity and providing correlated data that significantly accelerates the Mean Time to Resolution (MTTR) when incidents occur.
5. Datadog: A leading commercial observability platform known for its ability to unify logs, metrics, and distributed traces from various sources. Datadog offers excellent serverless monitoring capabilities, automatically collecting and correlating data from Lambda, Azure Functions, and GCP functions. Its features include automated detection of cold starts, real-time visualization of resource utilization, and granular cost reporting, providing a single pane of glass for multi-cloud serverless operations. Its comprehensive API allows it to manage and monitor security policy violations effectively.
6. Splunk: A powerful platform for searching, analyzing, and visualizing machine-generated data, commonly used for enterprise-grade log management. Splunk's serverless offerings allow for the ingestion and analysis of high volumes of function logs and metrics, often combined with security information and event management (SIEM) capabilities. Enterprises use Splunk for its massive scalability and sophisticated analytical query language, which is crucial for compliance auditing and forensic analysis in complex serverless applications.
7. New Relic: Another major commercial observability platform that provides deep insights into application performance. New Relic offers specific serverless instrumentation that tracks function duration, errors, and performance, correlating this data with the underlying cloud infrastructure. Its detailed tracing and mapping capabilities are highly valued for understanding bottlenecks in event-driven workflows, providing a cohesive view of application health from a single interface and helping to optimize code efficiency.
Serverless-Native Diagnostic Tools
The specialized nature of serverless requires tools built specifically to solve its unique diagnostic challenges, particularly cold starts and vendor-specific limitations. These tools offer enhanced, automated instrumentation and highly detailed diagnostic information that goes beyond basic metrics, focusing directly on the nuances of function execution and the cost implications of deployment design.
8. Lumigo: A serverless-native observability platform that focuses on automated distributed tracing and troubleshooting for AWS Lambda and related services. Lumigo provides agentless instrumentation that automatically maps out serverless components, detects errors, and flags high-latency cold starts without requiring manual code changes. Its core value is providing full end-to-end transaction visibility and debugging capabilities in the face of complex, event-driven architectures.
9. Thundra: Offering a specialized platform for serverless security, debugging, and monitoring, Thundra focuses on providing granular visibility into function execution. It offers features like automated security policy checks, performance tracing, and distributed debugging, enabling engineers to set breakpoints and inspect variables within live functions—a powerful capability in a transient execution environment. Its strong focus on security makes it a key tool for DevSecOps teams running serverless workloads.
10. Dashbird: A dedicated serverless monitoring and intelligence platform for AWS Lambda. Dashbird provides real-time insights, automated error detection, and detailed visualizations that help engineers quickly analyze function costs, performance, and log data. It simplifies the process of identifying outliers and performance regressions, focusing on providing actionable, serverless-specific operational insights derived from the data it collects.
Table: Key Serverless Monitoring Tools Comparison
The monitoring solutions for serverless environments fall broadly into cloud-native tools, which offer deep integration, and third-party platforms, which offer enhanced features and multi-cloud capabilities. This comparison table outlines the primary focus and hosting model of the top tools DevOps Engineers utilize for reliable serverless operations. It highlights the importance of tools that understand the ephemeral nature of functions and the distributed nature of the application architecture.
| Tool | Primary Focus | Core Capability | Tool Type |
|---|---|---|---|
| AWS CloudWatch | Native AWS Metrics/Logs | Basic metrics collection, logging, and integrated alerting. | Cloud-Native |
| AWS X-Ray | Distributed Tracing (AWS) | Visual service mapping and latency analysis for end-to-end requests. | Cloud-Native |
| Datadog | Unified Observability | Correlating logs, metrics, and traces across multi-cloud and hybrid environments. | Commercial SaaS |
| Lumigo | Serverless Debugging/Tracing | Automated instrumentation and detailed cold start analysis for AWS Lambda. | Serverless-Native SaaS |
| New Relic | Application Performance Monitoring (APM) | Deep performance metrics and transaction mapping across services. | Commercial SaaS |
Specialized Serverless Tools (Continued)
Beyond the major commercial platforms, the serverless ecosystem features highly specialized tools that focus on niche areas of operational complexity, such as cost analysis, security posture, and advanced tracing in complex, distributed systems. Integrating these tools allows engineers to finely tune their serverless architectures for maximum efficiency and security, moving beyond generic monitoring to performance engineering and cost governance.
11. Serverless Framework Pro: While the Serverless Framework is widely used for deploying FaaS applications, its Pro offering adds essential operational features like built-in monitoring, cost analysis, and advanced secrets management. This integration of monitoring directly into the deployment tool provides immediate, deployment-aware feedback and valuable insights into cost projections and resource utilization, helping teams maintain control over the budget in pay-per-use environments.
12. Epsagon (Cisco): Now part of Cisco, Epsagon specializes in automatic distributed tracing and monitoring across modern, highly distributed applications, including serverless, containers, and virtual machines. It provides full-stack visibility, automatically collecting traces and logs with no manual instrumentation required. Its agentless approach is highly effective in transient environments, giving engineers an immediate, correlated view of every transaction flow across services, which is essential for diagnosing issues in production.
The Serverless Monitoring Challenge: Distributed Tracing
The single greatest challenge in serverless monitoring is not data collection, but **distributed tracing**. Since a single user request might trigger a dozen different Lambda functions, interact with a database, and send a message through a queue before returning a response, diagnosing where latency occurs is impossible with simple logs or isolated metrics. Traditional systems ran on a single persistent server, allowing simple log file correlation, but the serverless architecture is inherently distributed.
Therefore, a monitoring tool's ability to automatically stitch together the flow of a single request across all transient, independent components (functions, APIs, queues, databases) is the most critical feature. Tools like X-Ray, Lumigo, and Datadog excel here by injecting unique transaction IDs into the request payload as it traverses the system. This allows the engineer to view a single, cohesive timeline of the user's transaction, quickly identifying the exact function or database call that exceeded its latency threshold, thereby accelerating troubleshooting from hours to minutes, which is paramount for high-velocity software delivery.
This challenge mirrors the complexity of networking in traditional systems, where engineers must understand how packets flow across different network layers. In serverless, the "network" is the flow of events and data between services, requiring a similar level of visualization and diagnostic skill to manage effectively. The complexity of these systems is a direct contrast to the simplicity of the underlying operational requirements, which are often abstracted from the engineer, unlike the days of managing every aspect of the Linux file system hierarchy.
The Serverless Cost and Efficiency Factor
Unlike traditional infrastructure, where costs are relatively static (monthly server fees), serverless costs are entirely usage-based (per millisecond, per invocation). This places a strong emphasis on cost efficiency and performance engineering, making cost monitoring an integral part of the DevOps Engineer's observability mandate. Monitoring tools must provide granular insights into function duration and memory usage to facilitate optimization, ensuring every function is provisioned with the lowest necessary resources to handle its workload without suffering performance degradation or costly cold starts.
Serverless monitoring directly enables cost optimization in several key areas:
- Cold Start Analysis: Tracking the time taken for functions to initialize, as excessive cold starts increase latency and cost. Tools like Lumigo flag these instances automatically.
- Memory Optimization: Granular metrics on memory usage allow engineers to right-size function memory allocations, paying only for the compute resources genuinely consumed by the application logic.
- Throttling and Concurrency: Monitoring concurrency limits and throttling events helps prevent costly service failures and allows engineers to adjust provisioning limits proactively before peak load periods.
- Resource Tagging and Attribution: Ensuring that every function and associated service is correctly tagged for FinOps attribution, allowing the business to accurately attribute costs to specific teams or product features for financial governance.
The cost factor is a major differentiator in serverless operations, driving the need for specialized monitoring tools that provide financial visibility alongside performance data, making the DevOps Engineer a crucial partner in cloud finance management.
Conclusion
The era of serverless computing requires a fundamental evolution in monitoring practices, demanding tools that can effectively track and diagnose issues within highly distributed, event-driven, and ephemeral environments. The 12 tools highlighted—from the cloud-native foundations of AWS CloudWatch and X-Ray to the specialized tracing and debugging platforms like Lumigo and Thundra—form the essential toolkit for any DevOps Engineer operating at the forefront of cloud-native development. Mastering these platforms is critical for moving beyond simple metrics collection to achieving true, correlated observability.
Ultimately, success in the serverless world is measured by performance, reliability, and cost-efficiency. By embracing specialized tools that excel at distributed tracing, cold start analysis, and granular resource optimization, engineering teams can maintain the high velocity of continuous delivery while ensuring system resilience and strict cost control. The complexity of the serverless architecture demands this proactive, data-driven approach to ensure that the abstraction of infrastructure translates into genuine operational advantage for the business.
Frequently Asked Questions
What is the biggest challenge in serverless monitoring?
The biggest challenge is distributed tracing, or tracking a single user request across multiple, transient, and independent function invocations and cloud services.
What is a serverless cold start?
A cold start is the increased latency that occurs when a function is invoked for the first time or after a period of inactivity, requiring the runtime environment to be initialized.
How does AWS X-Ray help with serverless issues?
AWS X-Ray provides visual service maps and traces that help engineers pinpoint exactly which function or service within a distributed flow is causing a performance bottleneck.
Why are traditional monitoring agents ineffective in serverless?
Traditional agents are ineffective because serverless functions are ephemeral; they lack a persistent host or operating system where a long-running agent can be installed and utilized effectively.
What is the purpose of distributed tracing?
Distributed tracing's purpose is to automatically stitch together the lifecycle of a single transaction across all microservices and functions to measure end-to-end latency and identify failures.
How does Datadog support a multi-cloud serverless strategy?
Datadog supports multi-cloud by providing a single platform to ingest, correlate, and visualize logs, metrics, and traces from functions running on AWS, Azure, and GCP.
What is the main advantage of Lumigo?
The main advantage of Lumigo is its serverless-native, agentless, and automated instrumentation that provides deep transaction visibility and troubleshooting without manual code changes.
How does serverless monitoring impact cost?
It impacts cost by providing granular metrics on function duration and memory usage, enabling engineers to right-size resource allocations and ensure strict cost control.
What is the role of CloudWatch Logs in serverless?
CloudWatch Logs aggregates and retains all the console and application log output generated by AWS Lambda functions during their ephemeral execution, ensuring data persistence.
What is a Service Map used for?
A Service Map is used to visualize the architecture of a distributed application, showing all interdependencies and event flows between functions, queues, and databases.
What is the role of the Serverless Framework Pro tool?
It integrates monitoring and cost analysis directly into the deployment workflow, providing immediate, deployment-aware feedback and cost projections for the FaaS functions.
Why should serverless teams focus on cost optimization?
Serverless costs are strictly usage-based, making cost optimization directly proportional to application efficiency and system performance, driving the need for continuous FinOps attention.
How does Thundra aid in serverless debugging?
Thundra aids debugging by offering features to trace application execution and even inspect variables within live, transient functions, which is difficult in ephemeral environments.
How is security policy managed in serverless?
Security policy is managed through specialized tools and services that check IAM roles, service configurations, and security groups attached to the FaaS functions before deployment.
What theoretical knowledge from traditional systems still applies?
Theoretical knowledge of system architecture, Linux kernel security features (like cgroups), and the fundamental challenges of distributed systems are still highly applicable for senior engineers.
What's Your Reaction?
 Like
0
 Dislike
0
 Love
0
 Funny
0
 Angry
0
 Sad
0
Sad
0
 Wow
0
Wow
0


![Kong Interview Preparation Guide [2025]](https://www.devopstraininginstitute.com/blog/uploads/images/202509/image_430x256_68dbb95326997.jpg)


![100+ Azure DevOps Interview Questions and Answers [Updated 2025]](https://www.devopstraininginstitute.com/blog/uploads/images/202509/image_140x98_68c40aa9a3834.jpg)


![90+ Git and GitHub Interview Questions [2025]](https://www.devopstraininginstitute.com/blog/uploads/images/202509/image_140x98_68c40a7931d60.jpg)


![Future Scope of DevOps Careers in Pune [Updated 2025]](https://www.devopstraininginstitute.com/blog/uploads/images/202510/image_140x98_68e3a84652312.jpg)


