12 Useful CLI Tools for Kubernetes Troubleshooting
Master the top twelve CLI tools that are essential for rapid Kubernetes troubleshooting and cluster management in twenty twenty six. This professional guide provides deep insights into powerful utilities like K9s, Stern, and Kubectx that help DevOps teams streamline their debugging workflows. Learn how to navigate complex resources, tail multi-container logs, and switch contexts with ease to maintain high availability in your cloud native environment. Whether you are an experienced SRE or a beginner developer, these expert-recommended tools will empower you to resolve production incidents faster and optimize your technical operations for maximum efficiency in today's demanding digital landscape.
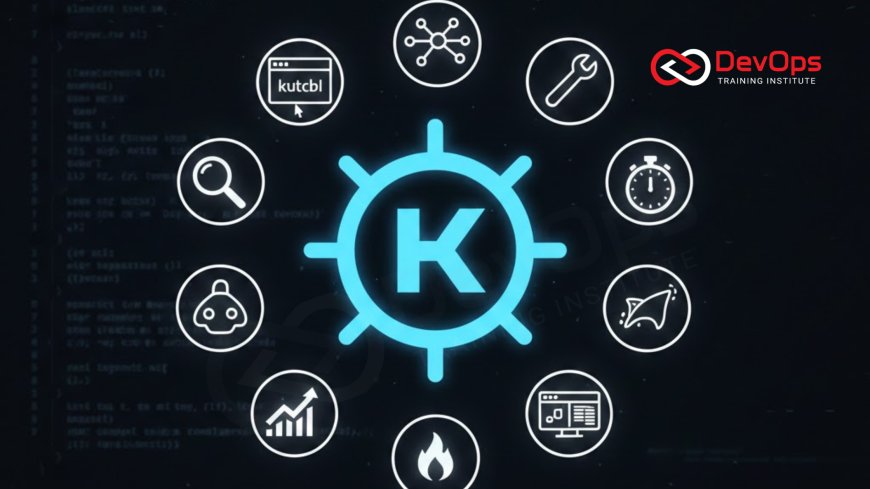
Introduction to CLI-Based Kubernetes Debugging
In the high-stakes world of container orchestration, the ability to quickly diagnose and resolve issues is a hallmark of a high-performing DevOps team. While Kubernetes provides a robust API and the standard kubectl utility, the sheer scale of modern clusters often makes manual troubleshooting a slow and tedious process. CLI tools designed specifically for troubleshooting allow engineers to bypass repetitive commands and gain immediate visibility into the health of their services. By utilizing these specialized utilities, you can reduce your Mean Time to Recovery (MTTR) and ensure that your continuous synchronization efforts remain stable under pressure.
As we move into twenty twenty six, the complexity of distributed systems continues to grow, making a "human-friendly" terminal interface more valuable than ever. These tools act as a force multiplier for your technical skills, turning the daunting task of hunting through thousands of pods into an intuitive and structured workflow. Whether you are managing cluster states or investigating a networking failure, having the right CLI tool in your belt is essential. This guide explores twelve of the most impactful tools that will help you master the art of Kubernetes troubleshooting and maintain peak operational excellence for your organization's digital services.
K9s: The Ultimate Terminal Dashboard
K9s is an interactive terminal UI that significantly speeds up how you navigate and manage your Kubernetes clusters. Instead of typing endless kubectl get pods commands, K9s provides a real-time, keyboard-driven interface that lets you view, edit, and delete resources with just a few keystrokes. It presents a holistic view of your cluster's health, making it much easier to spot failing pods or resource-hungry deployments at a glance. For teams undergoing a cultural change toward more agile operations, K9s is often the first tool adopted to bridge the gap between complexity and usability.
One of the standout features of K9s is its ability to seamlessly transition between different resource types and namespaces. You can jump from a pod view to its logs, or exec into a container shell without ever leaving the application. It also integrates with other security and best-practice tools, providing a unified workspace for your troubleshooting sessions. By utilizing who drives cultural change strategies, senior engineers can use K9s to demonstrate efficient debugging patterns to junior team members, fostering a culture of technical excellence and rapid response within the engineering department.
Stern: Multi-Pod and Multi-Container Log Tailing
When an issue occurs across multiple pods—such as during a canary rollout or a microservices interaction failure—the standard kubectl logs command is often insufficient. Stern addresses this by allowing you to tail logs from multiple pods and even multiple containers within those pods simultaneously. It uses a powerful regular expression matcher to select the pods you want to monitor, and it color-codes the output by pod name, making it incredibly easy to follow the flow of an multi-stage transaction across your distributed system in real time.
This level of visibility is vital for identifying race conditions or intermittent network errors that only appear when several services are interacting. Stern handles pod restarts automatically, ensuring that you don't lose the log stream when a container crashes and comes back up. This persistent monitoring is a cornerstone of modern ChatOps techniques for incident response, as it allows engineers to keep a "pulse" on the system during critical updates. By mastering Stern, you can cut through the noise of millions of log lines and find the specific error that is impacting your production environment with surgical precision.
Kubectx and Kubens: Rapid Context Switching
Managing multiple Kubernetes clusters or switching between dozens of namespaces can be a major source of friction and potential human error. Kubectx and Kubens are twin utilities that solve this problem by providing a fast and safe way to switch your active context and namespace. Instead of long-winded configuration commands, you can jump between production and staging clusters with a simple kubectx prod. This reduces the cognitive load on the engineer and prevents the accidental execution of destructive commands in the wrong environment, which is a major win for system safety.
Kubens works similarly for namespaces, allowing you to set a default namespace for all subsequent kubectl commands. This is particularly useful in large enterprise environments where microservices are isolated into hundreds of different logical segments. By keeping your continuous synchronization workflows organized with these tools, you ensure that your local development environment always matches your intended target. These utilities are often the most "under-the-radar" but most-used tools in a DevOps engineer's arsenal, providing a silent but significant boost to daily productivity and reducing the likelihood of configuration-based incident handling scenarios during routine maintenance.
Essential Troubleshooting Tools Comparison
| Tool Name | Primary Category | Key Debugging Feature | Best Use Case |
|---|---|---|---|
| K9s | Resource Navigation | Interactive TUI Dashboard | Daily cluster operations |
| Stern | Log Management | Multi-pod log tailing | Debugging microservices |
| Popeye | Cluster Sanitization | Configuration best-practices | Health audits |
| Netshoot | Networking | Ephemeral debug containers | Network connectivity issues |
| Telepresence | Development | Local-to-remote tunneling | Live debugging local code |
Popeye: Sanitizing Your Cluster Resources
Popeye is a read-only utility that scans your live Kubernetes cluster and reports potential issues with your deployed resources. It acts as a linting tool for your entire cluster, identifying misconfigurations, unused resources, and deviations from best practices. For example, it can flag pods that are missing resource limits, services with no active endpoints, or stale secrets that are no longer being used by any application. This proactive sanitization helps prevent the technical debt that often leads to mysterious performance degradation or security vulnerabilities in a busy cloud architecture patterns environment.
By running Popeye regularly, you can maintain a high standard of configuration quality across your organization. It provides an "efficiency score" for your cluster, giving you a clear metric to track your progress as you harden your environment. Many teams integrate Popeye into their CI/CD pipelines as an admission controllers check to ensure that only well-configured resources are allowed into production. This automated approach to quality assurance ensures that your infrastructure remains stable and cost-effective, allowing your developers to focus on building features rather than cleaning up architectural messes in their production clusters.
Netshoot: The Networking Swiss-Army Container
Networking issues are among the most difficult to troubleshoot in Kubernetes due to the complex layers of overlays, services, and ingresses. Netshoot is a specialized container image that bundles a massive set of powerful networking troubleshooting tools like tcpdump, nmap, and iperf. By spinning up a Netshoot pod using the kubectl debug command, you can enter the network namespace of a failing application container and perform live diagnostics. This allows you to verify DNS resolution, test port connectivity, and capture packets to see exactly why a service-to-service call is failing.
Using Netshoot as an ephemeral container ensures that you don't need to bloat your production images with troubleshooting binaries, which improves your security posture. It is a vital tool for choosing containerd vs Docker configurations, as it provides a consistent environment for network testing across different runtimes. Whether you are investigating a slow database connection or a misconfigured firewall rule, Netshoot provides the diagnostic depth required to find the root cause. It turns the often-opaque world of Kubernetes networking into a transparent and manageable technical layer for your SRE team.
Top 12 CLI Tools for Kubernetes Masters
- K9s: An interactive dashboard that makes cluster navigation and resource management fast and intuitive through a terminal UI.
- Stern: Allows for tailing multiple pods and containers at once using regular expressions for better log visibility.
- Kubectx / Kubens: Essential utilities for rapidly switching between cluster contexts and default namespaces to avoid human errors.
- Popeye: Scans your cluster for misconfigurations and stale resources to ensure adherence to industry best practices.
- Netshoot: A "swiss-army" container for deep network troubleshooting and packet analysis within your cluster's namespaces.
- Telepresence: Connects your local development machine to a remote cluster, allowing you to debug local code against live services.
- Kail: A lightweight Kubernetes log tailer that adjusts to the changing cluster by automatically tracking new pods as they appear.
- Polaris: Validates your Kubernetes resources against security and reliability standards with a simple dashboard and CLI.
- Botkube: Integrates your cluster with Slack or Teams, allowing you to run kubectl commands and receive alerts directly in chat.
- Kubestr: Identifies and benchmarks your Kubernetes storage options to ensure your persistent volumes are performing correctly.
- Kubespy: Provides a real-time, "top-like" view into the heart of a Kubernetes resource, tracing changes as they happen.
- Kustomize: A template-free way to customize Kubernetes configurations, built into kubectl to help manage cluster states easily.
Integrating these tools into your daily workflow requires a commitment to learning the specific "power-user" shortcuts and features of each. However, the investment pays off immediately in terms of time saved and errors avoided. By utilizing release strategies that incorporate these diagnostic tools, you create a more resilient delivery process. As you become more proficient, you might even consider building custom plugins for K9s or kubectl to automate your team's specific troubleshooting playbooks. The goal is to move beyond the basics and master the advanced tools that allow you to manage complex cloud native systems with confidence and technical precision.
Conclusion: Building a Proactive Troubleshooting Culture
In conclusion, the twelve CLI tools discussed in this guide provide a robust foundation for anyone looking to master Kubernetes troubleshooting in twenty twenty six. From the visibility of K9s and Stern to the deep diagnostics of Netshoot and the sanitization of Popeye, these utilities transform the way we interact with our clusters. By automating the routine parts of debugging, you free up your mental energy to focus on high-level architectural improvements and long-term stability. The key is to move from a reactive "firefighting" mode to a proactive and structured approach where issues are caught and resolved before they impact your users.
As you look toward the future, consider how continuous verification can further enhance your troubleshooting efforts by providing real-time data on your system's health. Staying informed about AI augmented devops trends will ensure that you are always using the most advanced tools available. Ultimately, the best tool is the one that your team uses consistently and effectively. By prioritizing these twelve CLI utilities today, you are building a faster, safer, and more efficient technical environment that can handle any challenge the cloud native world presents. Master your tools, secure your cluster, and lead your team to success.
Frequently Asked Questions
What is the benefit of using K9s over standard kubectl?
K9s provides an interactive, terminal-based dashboard that allows for much faster navigation, log viewing, and resource management through keyboard shortcuts.
How does Stern handle logs for multiple containers in one pod?
Stern tails all containers within a pod by default and color-codes each pod's output, making it easy to distinguish between log sources.
Why are kubectx and kubens important for safety?
They provide a fast and clear way to switch contexts and namespaces, which prevents accidental commands from being run in the wrong cluster environment.
Is Popeye safe to run on a production cluster?
Yes, Popeye is a read-only tool that only scans resource configurations and does not alter any of your live Kubernetes resources or data.
When should I use Netshoot for networking issues?
Use Netshoot when you need to perform deep diagnostics like packet captures or port scans from inside the network namespace of a specific pod.
What does Telepresence do for local development?
Telepresence creates a two-way proxy between your local machine and the cluster, allowing you to run local code as if it were in the cluster.
How does Botkube assist in team collaboration?
Botkube allows teams to run commands and receive notifications directly in Slack or Teams, making troubleshooting a collaborative effort in the chat interface.
What is the difference between Kustomize and Helm?
Helm uses a template-based approach to manage resources, while Kustomize uses a template-free overlay system to modify existing YAML manifests for different environments.
Can I use these CLI tools with any cloud provider?
Yes, as long as you have a standard kubeconfig file, these tools work with AWS, Azure, Google Cloud, and even local Minikube or Kind clusters.
What is a cluster sanitizer?
A cluster sanitizer like Popeye scans your cluster for misconfigurations, stale resources, and security risks, helping you maintain a clean and optimized environment.
How do I install most of these Kubernetes CLI tools?
Most of these tools can be installed via package managers like Homebrew or as plugins using the kubectl-krew plugin manager for your local machine.
What is the best tool for storage benchmarking?
Kubestr is a specialized tool that identifies and evaluates the performance of your Kubernetes storage options, ensuring your persistent volumes are configured correctly.
Can I build my own K9s plugins?
Yes, K9s is highly extensible and allows you to define custom plugins and aliases in its configuration file to match your specific workflow needs.
What role does secret scanning play in troubleshooting?
Secret scanning tools ensure that as you troubleshoot and modify configurations, you are not accidentally exposing sensitive credentials in your logs or manifests.
Which tool should a beginner start with?
K9s is highly recommended for beginners as it provides a visual way to explore the cluster while still operating within the terminal environment.
What's Your Reaction?
 Like
0
 Dislike
0
 Love
0
 Funny
0
 Angry
0
 Sad
0
Sad
0
 Wow
0
Wow
0


![Kong Interview Preparation Guide [2025]](https://www.devopstraininginstitute.com/blog/uploads/images/202509/image_430x256_68dbb95326997.jpg)


![100+ Azure DevOps Interview Questions and Answers [Updated 2025]](https://www.devopstraininginstitute.com/blog/uploads/images/202509/image_140x98_68c40aa9a3834.jpg)


![90+ Git and GitHub Interview Questions [2025]](https://www.devopstraininginstitute.com/blog/uploads/images/202509/image_140x98_68c40a7931d60.jpg)


![Future Scope of DevOps Careers in Pune [Updated 2025]](https://www.devopstraininginstitute.com/blog/uploads/images/202510/image_140x98_68e3a84652312.jpg)


