


![Kong Interview Preparation Guide [2025]](https://www.devopstraininginstitute.com/blog/uploads/images/202509/image_430x256_68dbb95326997.jpg)


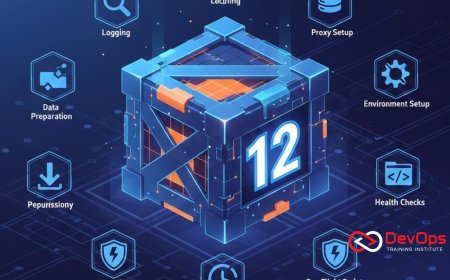
12 Steps to Debug Networking in Kubernetes
Master the intricate process of troubleshooting cluster connectivity with our comprehensive guide on the twelve essential steps to debug networking in Kubernetes. This detailed walkthrough covers everything from basic pod connectivity and service routing to complex DNS resolution and network policy enforcement. Learn how to use professional diagnostic tools and systematic workflows to identify bottlenecks and resolve communication failures in your cloud native environment. Whether you are dealing with intermittent latency or total service outages, these proven steps will empower your DevOps team to maintain high availability and peak performance across your entire distributed infrastructure today.
Introduction to Kubernetes Network Complexity
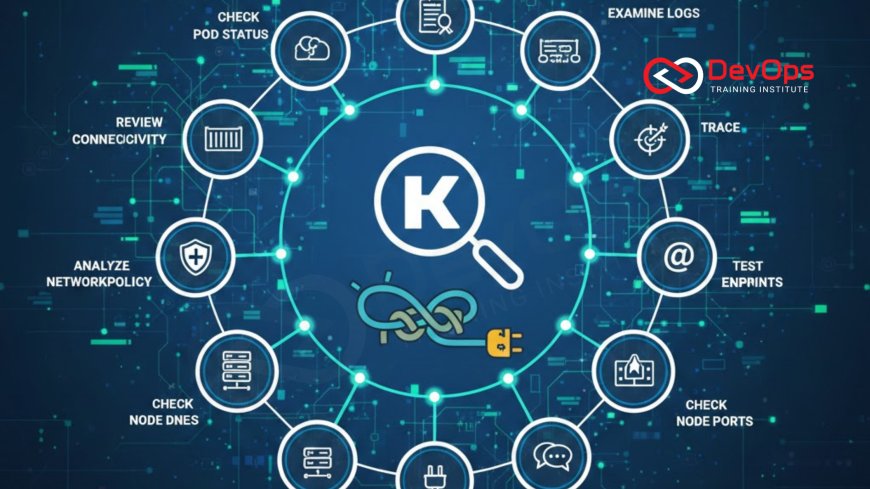
Kubernetes networking is often considered one of the most challenging aspects of container orchestration due to its multi layered architecture. In a healthy cluster, every pod must be able to communicate with every other pod across nodes without the use of Network Address Translation. This flat network model simplifies application development but places a significant burden on the underlying infrastructure and the Container Network Interface. When communication breaks down, the root cause could reside anywhere from the application code to the virtualized network stack of the cloud provider.
Debugging these issues requires a systematic approach that moves logically through the layers of the OSI model within the context of Kubernetes abstractions. As we move into twenty twenty six, the complexity of these environments continues to grow with the adoption of multi cluster setups and advanced service meshes. Understanding the flow of traffic from a user request down to an individual container is essential for any engineer tasked with maintaining system uptime. This guide provides a clear, step by step roadmap to help you navigate the maze of virtual interfaces, bridges, and routing rules that power your modern cloud architecture patterns.
Step One: Verifying Pod Status and Readiness
The first and most basic step in debugging any network issue is ensuring that the pods involved are actually running and in a ready state. A pod that is crashing or stuck in a pending state will obviously not be able to receive or send network traffic. Use the kubectl get pods command to check the status of your containers and look for any restarts that might indicate an underlying problem. It is also critical to check the readiness probes; if a pod is not marked as ready, the Kubernetes service will not route any traffic to it, even if the container is technically running.
Sometimes a pod may appear to be running but is failing internally due to a configuration error or a missing dependency. Review the pod logs and describe the resource to look for events related to failed probes or container crashes. If the pod is healthy but still unreachable, you can move on to testing direct connectivity. This initial verification ensures that you are not chasing a network phantom when the real issue is simply a failing application process. Maintaining a clean cluster states environment starts with ensuring that the fundamental building blocks of your application are functioning as intended.
Step Two: Testing Intra-Pod Connectivity
Once you have confirmed that your pods are running, the next step is to test the direct connectivity between them using their internal IP addresses. Kubernetes assigns a unique IP to every pod, and these should be reachable from any other pod in the cluster. You can use a temporary debug container to run tools like ping or curl against the target pod IP. If you can reach the pod via its IP but not through a service name, you have narrowed the problem down to the service discovery or DNS layer rather than the basic routing fabric.
If the direct IP connection fails, the issue likely lies with the Container Network Interface plugin or the underlying node networking. Check if the pods are on the same node or different nodes, as cross node communication failures often point to issues with the overlay network or cloud provider security groups. This step is vital for isolating the network layer involved in the failure. By verifying the basic data plane, you can determine if the problem is a low level routing issue or a higher level abstraction failure. This methodical isolation is a core part of effective incident handling in distributed systems.
Step Three: Inspecting Service and Endpoints
Kubernetes Services provide a stable IP and DNS name for a set of pods, acting as a local load balancer. If pod to pod communication works but service communication fails, you must inspect the Service and its associated Endpoints. Use the kubectl describe service command to verify that the service selector matches the labels on your pods. If the selector is incorrect, the service will have no endpoints, and any traffic sent to the service IP will effectively go nowhere. This is a common configuration mistake that can lead to significant downtime if not caught early.
Check the Endpoints object directly to see the list of pod IPs that the service is currently targeting. If the list is empty, even though your pods are running, double check your label consistency. Furthermore, ensure that the target port defined in the service matches the port that the application is actually listening on inside the container. Misaligned ports are a frequent source of "connection refused" errors. By ensuring the mapping between the service and the pods is correct, you satisfy a key requirement for continuous synchronization within the cluster. This step bridges the gap between the logical service definition and the actual running instances of your code.
Step-by-Step Diagnostic Tools Comparison
| Tool Name | Primary Use Case | Target Layer | Complexity |
|---|---|---|---|
| kubectl logs | App level errors | Application | Low |
| nslookup / dig | DNS resolution issues | Service Discovery | Medium |
| tcpdump | Packet level analysis | Network / Transport | High |
| traceroute | Hop by hop routing | Network | Medium |
| netstat / ss | Port listening status | Transport | Low |
Step Four: Troubleshooting CoreDNS Resolution
If you can reach a pod by IP but not by its service name, the problem almost certainly lies with the cluster DNS system, typically CoreDNS. DNS is the backbone of service discovery in Kubernetes, allowing pods to find each other using simple hostnames. Start by checking if the CoreDNS pods are running and healthy in the kube system namespace. Look at the logs for CoreDNS to see if there are any upstream resolution errors or configuration problems. A common issue is a loop in the DNS configuration or an inability to reach external nameservers, which can break both internal and external communication.
You can test DNS directly by running a lookup command from inside a pod using the full service name, such as my service dot namespace dot svc dot cluster dot local. If this fails, check the resolv dot conf file inside the pod to ensure it points to the correct DNS service IP. If DNS resolution is intermittent, it may be due to resource exhaustion in the CoreDNS pods, requiring you to scale the deployment or adjust the memory limits. Ensuring that your release strategies include DNS health checks is a best practice for maintaining a stable production environment where services can always find their dependencies without delay.
Step Five: Evaluating Network Policy Restrictions
Kubernetes Network Policies act as a built in firewall that controls the traffic allowed between pods. If your basic networking and DNS are working but certain pods still cannot talk to each other, you may have a restrictive Network Policy in place. These policies are namespace scoped and can block traffic based on labels, ports, and IP blocks. By default, if no policies exist, all traffic is allowed; however, as soon as a policy is applied to a pod, all other traffic to that pod is denied unless explicitly permitted. This "deny all" behavior is a frequent cause of unexpected connectivity drops during cultural change toward tighter security.
To debug this, check if any NetworkPolicy objects exist in the relevant namespaces. You can temporarily disable or delete a policy to see if connectivity is restored, which confirms the policy as the source of the block. It is also helpful to use tools that visualize network traffic and policies to see exactly what is being blocked. As you implement more complex admission controllers, ensuring that your network policies are correctly audited becomes even more important. A well configured policy set is essential for a zero trust architecture, but it requires careful management to avoid blocking legitimate application traffic accidentally.
The Remaining Steps for Deep Diagnostic Success
- Check Kube-Proxy Mode: Verify if kube proxy is running in iptables or IPVS mode and look for any stale or missing rules that might prevent traffic routing.
- Inspect CNI Plugin Logs: Review the logs of your CNI provider like Flannel, Calico, or Cilium to find errors related to IP address management or overlay tunnel failures.
- Verify Node Connectivity: Ensure that the physical or virtual nodes can communicate with each other over the required ports for the cluster network.
- Analyze Ingress Controller: If external traffic is failing, check the Ingress controller logs and the configuration of your load balancer to ensure the path is clear.
- Trace MTU Mismatches: Look for packet fragmentation issues that can occur if the Maximum Transmission Unit of the pod network is larger than the underlying physical network.
- Examine Node Port Conflicts: Ensure that services using NodePort are not conflicting with other processes on the host and that the port range is accessible through firewalls.
- Use Continuous Verification: Implement continuous verification tools that constantly probe the network and alert you to any changes in connectivity before users report them.
By following these remaining steps, you can dive deeper into the host level and infrastructure layer problems that often hide from standard application monitoring. For instance, knowing when containerd is better can help you optimize the runtime performance that impacts how quickly network interfaces are created and destroyed. Using secret scanning tools as part of your troubleshooting process ensures that you don't accidentally expose sensitive cluster credentials while sharing logs or debug data with your team. A holistic approach to debugging ensures that no stone is left unturned in the quest for a perfectly functioning network.
Conclusion: Building a Resilient Network Culture
In conclusion, debugging networking in Kubernetes is a complex but manageable task when approached with a clear strategy and the right set of tools. By moving systematically from pod status to service discovery and eventually to host level routing, you can isolate and resolve even the most elusive connectivity issues. The twelve steps outlined here provide a solid foundation for any DevOps team looking to improve their troubleshooting capabilities. As clusters grow in scale and complexity, the ability to rapidly diagnose network failures becomes a critical competitive advantage that ensures the reliability of your digital services.
As you master these steps, consider how AI augmented devops could further streamline your diagnostic process in the future. Integrating GitOps for your network configurations can help prevent errors before they ever reach production. Remember that networking is the lifeblood of your distributed system; treating it with the respect and technical rigor it deserves will lead to a more stable and high performing application environment. Stay curious, keep testing, and never stop refining your network debugging skills as the cloud native landscape continues to evolve toward twenty twenty six.
Frequently Asked Questions
What is the first thing I should check when a service is unreachable?
You should first check the pod status and readiness probes to ensure the containers are running and marked as healthy by Kubernetes.
How do I see the IP addresses of all pods in a namespace?
You can use the kubectl get pods command with the wide output flag to see the internal IP addresses assigned to each pod.
What does it mean when a service has no endpoints?
It usually means the service selector labels do not match the labels on any running pods, so the service has no targets.
Why can I reach a pod by IP but not by its DNS name?
This usually indicates an issue with the cluster DNS service, such as CoreDNS, or a misconfiguration in the pod's DNS settings.
How can I test network connectivity from inside a pod?
You can use the kubectl exec command to run tools like curl, ping, or telnet from within a running container for direct testing.
What is the role of kube-proxy in Kubernetes networking?
Kube proxy manages the network rules on nodes to allow for traffic forwarding and load balancing to the correct backend pods for services.
Can a Network Policy block traffic between pods in the same namespace?
Yes, Network Policies can be configured to restrict any traffic, including communication between pods that reside in the same Kubernetes namespace effectively.
What is a CNI plugin and why is it important?
The CNI plugin is responsible for configuring the network interfaces and connectivity for pods, ensuring they can communicate across the entire cluster.
How do I debug an Ingress controller issue?
Check the Ingress controller logs for configuration errors and verify that the ingress rules correctly map to the existing backend services.
What is an MTU mismatch and how does it affect networking?
An MTU mismatch occurs when packet sizes exceed the limit of a network segment, causing packet loss or significant performance degradation in the cluster.
How do I check the logs of the CoreDNS pods?
Use the kubectl logs command targeting the CoreDNS pods located in the kube system namespace to see any resolution or startup errors.
Can I use tcpdump to troubleshoot Kubernetes networking?
Yes, you can run tcpdump in a sidecar container or on the node to capture and analyze the actual network packets for debugging.
What is the difference between a ClusterIP and a NodePort service?
ClusterIP is only accessible within the cluster, while NodePort exposes the service on a specific port on every node's IP address for external access.
How does GitOps help with network debugging?
GitOps ensures that your network configurations are versioned and auditable, making it easy to identify and roll back any changes that caused issues.
What is a common cause of intermittent network latency?
Intermittent latency is often caused by resource contention, network congestion, or misconfigured load balancing algorithms within the Kubernetes cluster or cloud provider.
What's Your Reaction?
 Like
0
Like
0
 Dislike
0
Dislike
0
 Love
0
Love
0
 Funny
0
Funny
0
 Angry
0
Angry
0
 Sad
0
Sad
0
 Wow
0
Wow
0


![100+ Azure DevOps Interview Questions and Answers [Updated 2025]](https://www.devopstraininginstitute.com/blog/uploads/images/202509/image_140x98_68c40aa9a3834.jpg)


![Future Scope of DevOps Careers in Pune [Updated 2025]](https://www.devopstraininginstitute.com/blog/uploads/images/202510/image_140x98_68e3a84652312.jpg)


