


![Kong Interview Preparation Guide [2025]](https://www.devopstraininginstitute.com/blog/uploads/images/202509/image_430x256_68dbb95326997.jpg)


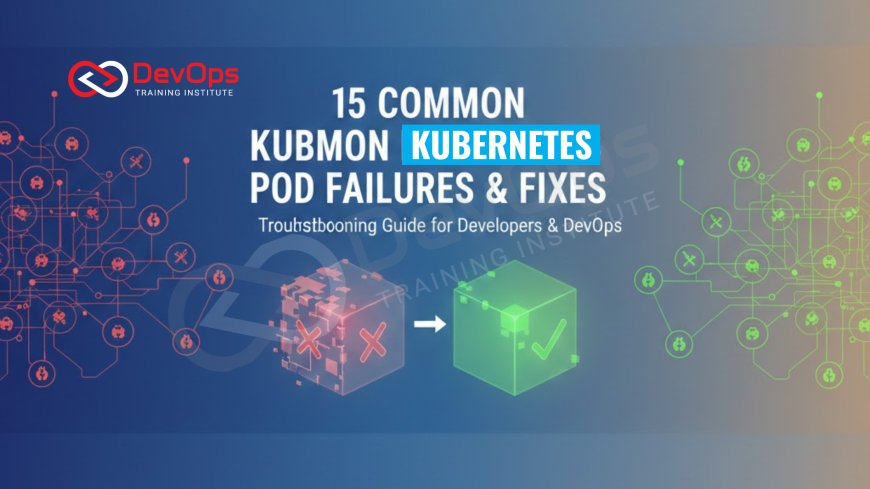
15 Common Kubernetes Pod Failures & Fixes
Understanding Kubernetes pod failures is essential for maintaining high system availability and operational excellence. This comprehensive guide details fifteen common issues ranging from CrashLoopBackOff to ImagePullBackOff, providing clear explanations and practical fixes for each. By mastering these troubleshooting techniques, developers and operations teams can ensure their containerized applications remain resilient, performant, and reliable in complex production environments while reducing downtime and improving the overall user experience across the entire digital infrastructure.
Introduction to Kubernetes Pod Troubleshooting
Kubernetes has revolutionized the way we deploy and manage applications by providing a powerful platform for container orchestration. However, with great power comes the complexity of managing distributed systems. One of the most common challenges that engineers face is dealing with pod failures. A pod is the smallest deployable unit in Kubernetes, and when it fails to start or run correctly, it can disrupt your entire service delivery pipeline and impact end users.
In this detailed guide, we will explore fifteen of the most frequent pod failures that occur in real world environments. We will explain what these errors mean in simple terms and provide actionable steps to fix them. Whether you are a beginner just starting your journey or an experienced professional looking to sharpen your debugging skills, understanding these failure patterns is the first step toward building a more stable and resilient cloud native infrastructure for your organization.
Understanding Resource Constraints and OOMKilled
One of the most frequent reasons a pod fails is due to resource limitations. In Kubernetes, you can define how much CPU and memory a container is allowed to use. When a container exceeds its memory limit, the system invokes the Out Of Memory killer, or OOMKilled status. This is a protective measure by the Linux kernel to prevent a single container from starving the entire node of its necessary resources, which would cause a complete system crash.
To fix this, you need to examine your resource requests and limits. If your application is consistently being killed, it likely needs more memory allocated to it. However, it is also important to check for memory leaks within your code. By using observability tools to track memory usage over time, you can determine if the failure is due to a sudden spike in traffic or a gradual climb in resource consumption that indicates a deeper software bug within the application logic itself.
Image Related Issues and Pull Failures
Before a pod can even start running, Kubernetes must be able to download the container image from a registry. If this process fails, you will often see the ImagePullBackOff or ErrImagePull status. This usually happens because the image name is misspelled, the tag does not exist, or the cluster does not have the correct permissions to access a private registry. It is one of the simplest errors to fix, yet it remains one of the most common stumbling blocks for new teams.
To resolve these issues, you should first verify the image path and tag in your deployment manifest. If the image is private, ensure that you have created an ImagePullSecret and attached it to your service account or pod specification. Ensuring that your registry credentials are up to date and correctly configured is a vital part of maintaining a smooth automation workflow. Testing your image pull manually from a local machine can also help confirm if the registry is currently reachable and functioning as expected.
Networking and Service Connection Errors
Kubernetes pods often need to communicate with other services or databases. Networking failures occur when a pod cannot resolve a DNS name or reach an IP address due to incorrect network policies or firewall rules. If a pod starts but cannot perform its work because it cannot connect to its dependencies, it might crash or remain in a degraded state. This highlights the importance of having a clear understanding of the cluster networking model and how services interact.
Fixing network issues involves checking the internal DNS service and verifying that your Service objects are correctly targeting the right pods. You should also inspect NetworkPolicies that might be blocking traffic between different namespaces. In complex environments, adopting platform engineering practices can help standardize network configurations and reduce the risk of manual errors. Ensuring that your pods have the correct environment variables and connection strings is also a critical step in the troubleshooting process for any distributed system.
Table: Summary of Common Pod Failures
| Failure Type | Common Status | Likely Cause | Primary Fix |
|---|---|---|---|
| Resource Overload | OOMKilled | Memory limit reached. | Increase memory limits. |
| Registry Access | ImagePullBackOff | Wrong credentials or path. | Check ImagePullSecrets. |
| Application Crash | CrashLoopBackOff | App fails immediately. | Check application logs. |
| Scheduling Issue | Pending | No nodes available. | Check node resources/taints. |
| Probe Failure | Unhealthy | Check failed repeatedly. | Adjust probe settings. |
The Mystery of CrashLoopBackOff
CrashLoopBackOff is perhaps the most frustrating error for beginners because it is a generic signal that the pod is failing and restarting repeatedly. It means that the container starts, runs for a few seconds, and then exits with an error code. Kubernetes then waits for a short period before trying to start it again, increasing the delay with each attempt to prevent overwhelming the system with useless restarts. This error is almost always caused by an issue within the application code or its configuration.
To diagnose a CrashLoopBackOff, your first step should always be to check the pod logs. This will reveal if the application is missing a required file, cannot connect to a database, or is experiencing a syntax error in its startup script. You should also check the events in the namespace using the describe pod command to see if there are any hints from the container runtime. Often, a simple missing environment variable or a misconfigured volume mount is the culprit behind this persistent and annoying failure loop.
Scheduling Failures and Pending Pods
When a pod remains in the Pending state for a long time, it means the Kubernetes scheduler cannot find a suitable node to place it on. This can happen for several reasons, such as all nodes being out of CPU or memory, or the pod having specific requirements that none of the nodes can satisfy. For example, if a pod requires a specific type of hardware like a GPU and no nodes have that capability, the pod will never be scheduled and will stay in limbo until a suitable node is added.
Checking the reasons for a pending status involves looking at the output of the describe pod command. The scheduler will usually list why it was unable to place the pod. If your nodes are full, you may need to add more capacity or optimize your existing resources to reduce cloud spend. You should also check for taints and tolerations, which are rules that prevent pods from being scheduled on certain nodes. Understanding how the scheduler makes decisions is essential for maintaining a healthy and balanced cluster environment for your applications.
Probes and Health Check Failures
Kubernetes uses liveness and readiness probes to determine if a pod is healthy and ready to serve traffic. If these probes are misconfigured, Kubernetes might kill a perfectly functional pod or prevent a healthy pod from receiving traffic. A liveness probe that is too aggressive might restart a container that is simply taking a long time to initialize, while a readiness probe that never succeeds will keep your service unavailable even if the application is running fine in the background.
Common failures in health checks include:
- Setting the initial delay too low, causing the probe to fail before the app has finished booting.
- Using the wrong port number or endpoint for the probe check.
- The health check endpoint itself being blocked by internal security rules.
- Heavy load causing the application to respond slowly to the probe, leading to a timeout.
To fix these issues, you should adjust the timeout and failure threshold settings to better match your application's actual startup behavior and performance characteristics.
Advanced Failures and Resilience Strategies
Beyond the common errors, sophisticated teams must also prepare for complex failure modes like node pressure or storage volume deadlocks. These issues often require a deeper understanding of the underlying infrastructure and how Kubernetes interacts with cloud providers. As systems grow in scale, the likelihood of encountering these edge cases increases. This is why many organizations are turning to chaos engineering to proactively test their cluster's resilience by intentionally injecting faults and observing how the system recovers under stress.
By simulating pod failures and node outages, you can verify that your high availability configurations are working as expected. This proactive approach ensures that your blue-green deployment strategies and automated failover mechanisms are robust enough to handle real world disasters. Building a culture of resilience means moving beyond simple fixes and designing systems that are inherently fault tolerant. This not only improves uptime but also provides peace of mind for the engineering team, knowing that the system can handle unexpected failures without requiring manual intervention in the middle of the night.
Conclusion
Mastering Kubernetes pod failures is a journey that requires patience, curiosity, and a systematic approach to troubleshooting. We have explored fifteen of the most common issues that can disrupt your applications, from resource exhaustion and image pull errors to the complexities of scheduling and health check failures. By understanding the root causes of these errors and following the practical fixes outlined in this guide, you can significantly reduce your mean time to recovery and build a more stable platform for your users. Remember that every failure is an opportunity to learn more about your system and improve your shift-left testing practices. As you gain experience, you will find that many of these errors become predictable and easy to resolve. The goal is not just to fix pods when they break, but to build an environment where failures are handled gracefully and automatically by the platform itself, allowing you to focus on delivering value to your customers and driving innovation within your organization.
Frequently Asked Questions
What does CrashLoopBackOff mean in Kubernetes?
It means a pod is failing and restarting repeatedly, usually due to an internal application error or a configuration problem.
How do I fix an ImagePullBackOff error?
Check the image name for typos, verify the tag exists, and ensure your gitops workflow has the correct registry credentials.
Why is my pod stuck in a Pending state?
The scheduler cannot find a node with enough CPU or memory or the pod requirements do not match any available nodes.
What causes a pod to be OOMKilled?
The pod tried to use more memory than its defined limit allowed, causing the system to terminate it to protect the node.
What is the difference between a liveness and readiness probe?
A liveness probe checks if a pod is alive to restart it while a readiness probe checks if it can accept traffic.
How can I see the logs of a failed pod?
You can use the logs command with the pod name to see the application output and identify any errors during startup.
Can a pod fail due to network policies?
Yes, if a network policy blocks communication to required services like databases, the application may fail to function correctly and crash.
What should I do if a pod is evicted?
Eviction usually happens when a node is under resource pressure, so you should check node health and perhaps move pods elsewhere.
How do feature flags affect pod stability?
Using feature flags allows you to disable broken features without restarting pods, which can help maintain stability during a buggy rollout.
Why are resource limits important for pods?
Limits prevent a single pod from consuming all node resources, ensuring that other containers on the same host can continue running smoothly.
What is a node taint in Kubernetes?
A taint is a property of a node that prevents pods from being scheduled there unless the pod has a matching toleration.
How do I debug a service connection issue?
Check the service and endpoint objects to ensure they are pointing to the correct pod IP addresses and using the right ports.
What is the purpose of describe pod command?
This command provides detailed events and status information that are essential for understanding why a pod has failed to start correctly.
Can storage volume issues cause pod failures?
Yes, if a volume cannot be mounted or is already in use by another node, the pod will fail to start.
How do canary releases help with pod failures?
Canary releases let you test a new pod version on a small group of users, limiting the impact if it fails.
What's Your Reaction?
 Like
0
Like
0
 Dislike
0
Dislike
0
 Love
0
Love
0
 Funny
0
Funny
0
 Angry
0
Angry
0
 Sad
0
Sad
0
 Wow
0
Wow
0

![100+ Azure DevOps Interview Questions and Answers [Updated 2025]](https://www.devopstraininginstitute.com/blog/uploads/images/202509/image_140x98_68c40aa9a3834.jpg)


![Future Scope of DevOps Careers in Pune [Updated 2025]](https://www.devopstraininginstitute.com/blog/uploads/images/202510/image_140x98_68e3a84652312.jpg)


