15 DevOps Real-Time Monitoring Strategies
Discover the ultimate guide to fifteen essential DevOps real-time monitoring strategies designed to elevate your system reliability and performance. This comprehensive article explores proactive approaches to tracking application health, infrastructure stability, and user experience. Learn how modern engineering teams leverage advanced observability techniques to detect anomalies, reduce downtime, and ensure seamless delivery across complex cloud environments while fostering a culture of continuous improvement and operational excellence in today's fast-paced digital world.
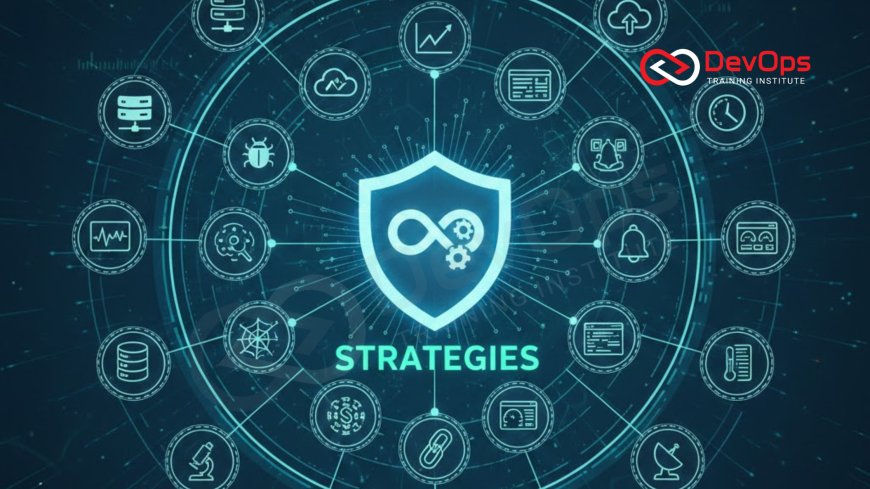
Introduction to Modern Monitoring Paradigms
In the current technological era, the ability to see exactly what is happening within your software systems at any given moment is not just a luxury but a fundamental necessity. As applications transition from simple servers to complex, distributed microservices, the old ways of checking server health once a day are no longer sufficient. DevOps teams must now implement sophisticated real-time monitoring strategies to ensure that their services remain available, performant, and secure for a global user base that expects perfection around the clock.
Real-time monitoring provides the immediate feedback loop required to maintain high-velocity software delivery. It allows engineers to catch tiny fluctuations in performance before they cascade into major system outages. By establishing a solid foundation of visibility, organizations can build more resilient systems and respond to incidents with surgical precision. This guide will explore fifteen powerful strategies that help modern teams navigate the complexities of cloud-native infrastructure, ensuring that every deployment is backed by data and every incident is met with an informed response.
The Shift from Basic Monitoring to Full Observability
Traditional monitoring was largely about knowing when a system went down. Engineers would set up simple alerts for CPU usage or disk space and react when a threshold was crossed. However, modern systems require a deeper level of insight to understand not just that something is wrong, but why it is happening. This is where the concept of observability becomes critical. It involves collecting and correlating metrics, logs, and traces to provide a holistic view of the system's internal state.
By moving toward an observability-first mindset, teams can ask complex questions of their systems that they never anticipated. This strategy involves instrumenting code to emit rich telemetry data, which can then be analyzed in real-time. Instead of just seeing a spike in errors, an observable system allows you to trace a specific failed request back through multiple services to find the exact database query that caused the bottleneck. This depth of understanding is essential for maintaining the high standards required in a competitive digital marketplace where every millisecond of latency can impact the bottom line.
Implementing Infrastructure as Code for Visibility
Visibility should not be an afterthought added once the servers are running; it should be baked into the very foundation of the environment. Professionals use Infrastructure as Code (IaC) to define their monitoring agents, dashboards, and alerting rules alongside their server configurations. This ensures that every new resource created is automatically tracked from the second it comes online. By treating your monitoring setup as code, you ensure consistency across development, staging, and production environments.
This automated approach to visibility is a key component of platform engineering, where the goal is to provide developers with a self-service environment that includes all the necessary guardrails. When the infrastructure itself is responsible for reporting its health, the burden on individual engineers is reduced. This strategy prevents "monitoring gaps" where certain parts of the system are ignored because someone forgot to manually add them to a dashboard. It creates a seamless experience where data flows naturally from the hardware to the decision-makers.
Dynamic Alerting and Anomaly Detection
One of the biggest challenges in real-time monitoring is managing the sheer volume of data. If every small fluctuation triggers a notification, engineers quickly suffer from alert fatigue and begin to ignore important signals. To solve this, teams are moving toward dynamic alerting and anomaly detection. Instead of using static thresholds, these systems use machine learning to understand what "normal" behavior looks like for a specific time of day or day of the week, only triggering an alert when something truly unusual occurs.
Dynamic alerting is particularly useful for applications with highly variable traffic patterns. For example, a system that handles thousands of requests per second during the day might only see a handful at night. A static threshold that works for peak hours would be useless during the quiet period. By automating the baseline, the system becomes much smarter. This proactive approach allows teams to catch subtle performance regressions or security threats that would otherwise stay hidden under the radar of traditional, rigid monitoring setups.
Table: Real-Time Monitoring Metric Categories
| Metric Category | Primary Focus | Key Real-Time Strategy | DevOps Benefit |
|---|---|---|---|
| Application Health | Error rates and response times | Distributed tracing and APM instrumentation | Rapid root-cause analysis for user-facing issues. |
| Infrastructure Status | CPU, Memory, Disk, and Network | Agent-based real-time telemetry streaming | Prevents resource exhaustion and hardware failure. |
| Security Events | Login attempts and unauthorized access | SIEM integration with real-time log analysis | Immediate detection and mitigation of cyber threats. |
| Cloud Economics | Cloud spend and resource waste | Automated cost tracking per service or team | Optimizes budget allocation and reduces waste. |
| User Experience | Page load speed and UI responsiveness | Real User Monitoring (RUM) and synthetic tests | Ensures high customer satisfaction and retention. |
Log Aggregation and Centralized Search
Logs are a goldmine of information, but they are often scattered across hundreds of different containers and virtual machines. A critical monitoring strategy involves aggregating all these logs into a single, centralized system where they can be indexed and searched in real-time. This allows engineers to see a unified timeline of events across the entire infrastructure. When an error occurs in one service, you can immediately see the related logs in the database or authentication service that happened at the exact same millisecond.
Centralized logging also provides a foundation for long-term trend analysis and compliance auditing. By using tools like the ELK Stack or Splunk, teams can build dashboards that visualize log patterns over weeks or months. This is particularly useful for identifying recurring issues that are too small to trigger an alert but cause significant cumulative impact. This data-driven approach ensures that the engineering team is always working with a single source of truth, reducing the time spent on "finger-pointing" during incident resolution and fostering a culture of technical accountability.
Real-Time Distributed Tracing for Microservices
In a monolithic application, tracking a request was simple because it stayed on one server. In a modern microservices architecture, a single user click might trigger a chain of dozens of requests across different services, databases, and third-party APIs. Distributed tracing is the strategy of assigning a unique ID to that initial request and following it through every hop in the network. This provides a clear "map" of the request's journey, making it easy to see exactly where a delay or an error occurred.
This strategy is vital for identifying "hidden" bottlenecks that only appear under specific conditions. For example, a service might be performing perfectly on its own but becomes slow when called by a specific combination of other services. Real-time tracing allows you to visualize these dependencies and optimize the path of data through your system. It is an essential tool for any team managing a complex service mesh, providing the clarity needed to maintain high performance and reliability in an increasingly interconnected world of software.
Monitoring the Software Delivery Pipeline
Monitoring should not stop at the production environment; it must also extend to the tools that build and deploy the software. Tracking the health of your CI/CD pipelines allows you to identify bottlenecks in the development process itself. If builds are taking longer than usual or if deployments are frequently failing, real-time metrics can help you find the root cause. This strategy ensures that the "machine that builds the software" is running as efficiently as the software itself.
This internal visibility is often linked to gitops practices, where every change to the infrastructure is tracked through Git. By monitoring the pipeline, you can see how long it takes for a code change to move from a developer's machine to the live environment. This metric, known as lead time for changes, is a key indicator of organizational agility. Maintaining a healthy and fast pipeline allows for more frequent releases and a faster response to market changes or security vulnerabilities discovered in the wild.
Proactive Resilience and Fault Injection
Waiting for something to break is a reactive strategy. High-performing teams take a proactive approach by deliberately introducing faults into their systems to see how the monitoring and self-healing mechanisms respond. This is the core of chaos engineering, where real-time monitoring is used to verify that the system handles failure gracefully. If you kill a database instance, do your dashboards show the failover happening automatically, or does the system go dark?
These controlled experiments are essential for building confidence in your infrastructure. They allow you to test your alerting rules and incident response procedures under realistic conditions without waiting for an actual disaster. By observing the system's behavior during a "drill," you can identify gaps in your monitoring coverage or flaws in your architecture. This strategy turns reliability into a measurable and improvable metric, ensuring that your team is prepared for any situation that might arise in a production environment.
- Network Latency Injection: Seeing how application timeouts behave when the network slows down.
- Service Termination: Verifying that load balancers correctly redirect traffic when a service goes offline.
- Disk Space Exhaustion: Ensuring that alerts trigger before a database can no longer write data.
- Credential Invalidation: Checking if security monitoring catches an unauthorized attempt to use expired keys.
Real User Monitoring and Frontend Visibility
A server might be healthy, but that doesn't mean the user is having a good experience. Real User Monitoring (RUM) is a strategy that collects data directly from the user's browser or mobile device. This provides insight into page load times, JavaScript errors, and UI responsiveness across different devices and geographic locations. RUM is critical because it captures the "last mile" of the user's journey, which is often affected by things like local ISP issues or slow hardware that server-side monitoring cannot see.
By correlating frontend data with backend metrics, teams can get a complete picture of application health. This is particularly useful when using canary releases to roll out new features. You can monitor the RUM data for the small group of users on the new version to ensure that the user experience hasn't regressed before deploying to everyone. This strategy ensures that performance improvements are not just theoretical but are actually felt by the people using the software every day.
Cost Visibility and Financial Operations
In a cloud-native world, resources are elastic, but budgets are not. Real-time monitoring of cloud spend is becoming an essential DevOps strategy, often referred to as finops. By tracking the cost of every service and environment in real-time, teams can identify "resource leaks" or unoptimized architectures that are wasting money. This financial visibility ensures that the technical success of the application is matched by its economic sustainability.
Modern cost monitoring tools can alert teams when spending spikes unexpectedly, allowing for immediate investigation. For example, a bug in a scaling script might spin up hundreds of unnecessary instances, leading to a massive bill if not caught quickly. By integrating cost metrics into the standard DevOps dashboards, engineers become more aware of the financial impact of their technical choices. This shared responsibility for cloud efficiency allows the organization to scale its infrastructure intelligently while maximizing the value of every dollar spent on cloud resources.
Security Monitoring and Automated Response
Security is no longer a separate gate at the end of the process; it must be monitored in real-time alongside performance. This involves tracking login patterns, file changes, and network traffic for signs of unauthorized activity. By integrating security into the DevOps workflow, a practice known as devsecops, teams can detect and mitigate threats much faster than traditional periodic audits would allow.
Real-time security monitoring often includes automated responses, such as blocking an IP address that is attempting a brute-force attack or isolating a container that shows signs of compromise. This speed of response is critical in a world where automated attacks can happen in milliseconds. By providing engineers with real-time security data, you empower them to build more secure applications from the start. Security becomes a visible, measurable part of the system's overall health, ensuring that the application remains trustworthy and resilient against an ever-evolving landscape of cyber threats.
Synthetics and Proactive Health Checks
While RUM monitors real users, synthetic monitoring uses automated scripts to simulate user behavior from different locations around the world. This strategy is vital for identifying issues during quiet periods when there are no real users on the system. Synthetic tests can proactively check critical workflows, such as "adding an item to a cart" or "completing a checkout," every few minutes to ensure they are working as expected. If a synthetic test fails, the team is alerted before the first real user of the day encounters the problem.
Synthetics are also useful for monitoring third-party dependencies. If your application relies on an external API for payments or mapping, synthetic tests can track the availability and latency of that service. This allows you to differentiate between an internal problem and an issue with a provider. By establishing a baseline of performance through synthetic testing, you can set realistic Service Level Objectives (SLOs) and hold your providers accountable for the quality of service they deliver to your organization.
Quality Metrics and Shift-Left Monitoring
Monitoring is traditionally seen as a production activity, but the strategy of "shifting left" involves moving these checks earlier into the development and testing phases. By monitoring the performance of new code during the testing phase, teams can catch regressions before they ever reach a user. This is a critical part of a shift left testing strategy, where the goal is to find and fix issues when they are cheapest to resolve.
This approach involves using feature flags to toggle new code on in a staging environment while monitoring its impact on system resources. If the new feature causes a 20 percent spike in memory usage, the team can investigate and optimize the code before it is merged into the main branch. By making monitoring part of the development ritual, you ensure that high-quality, performant code becomes the standard. It fosters a proactive mindset where performance is considered a feature of the software, not an afterthought to be fixed later.
Conclusion
Real-time monitoring is the pulse of a healthy DevOps organization. By implementing these fifteen strategies, teams can move away from reactive firefighting and toward a more proactive, data-driven approach to system management. We have seen how the transition to full observability, the use of Infrastructure as Code, and the implementation of distributed tracing provide the deep insights needed to manage modern microservices. We also explored how chaos engineering and synthetic testing allow teams to proactively identify weaknesses, while FinOps and DevSecOps ensure that systems are financially and operationally secure. Ultimately, the goal of real-time monitoring is to provide the clarity and confidence needed to innovate at high speeds. When you have a clear view of your system's health, you can deploy more frequently, recover faster from incidents, and provide a superior experience for your users. Embracing these professional strategies is not just a technical upgrade; it is a commitment to excellence that ensures your organization remains resilient and competitive in an increasingly complex and demanding digital landscape.
Frequently Asked Questions
What is real-time monitoring in DevOps?
Real-time monitoring involves the continuous collection and analysis of system data to provide immediate feedback on application health and performance.
Why is observability different from monitoring?
Monitoring tells you if a system is healthy, while observability provides the context to understand why a system is behaving a certain way.
How does distributed tracing help microservices?
It allows you to track a single request across multiple services, making it easy to find where delays or errors are occurring in the chain.
What are the four golden signals?
The four golden signals of monitoring are latency, traffic, errors, and saturation, which together provide a clear picture of system health.
How does chaos engineering relate to monitoring?
Chaos engineering uses monitoring to verify that a system handles injected failures gracefully and that alerts trigger as expected during an incident.
What is Real User Monitoring (RUM)?
RUM collects performance data directly from the browsers and devices of real users to provide insight into their actual experience with the application.
How does FinOps integrate with monitoring?
FinOps uses real-time monitoring to track cloud spending and resource waste, helping teams optimize their budgets and improve financial efficiency.
What is a synthetic test?
A synthetic test uses automated scripts to simulate user actions, checking that critical paths like login or checkout are working 24/7.
Why should monitoring "shift left"?
Moving monitoring into the development and testing phases helps catch performance issues and bugs earlier when they are easier and cheaper to fix.
How do feature flags assist in monitoring?
They allow you to toggle features on for a small group and monitor their impact separately, ensuring a safe rollout to the wider user base.
What is alert fatigue?
Alert fatigue happens when engineers receive too many non-critical notifications, causing them to miss or ignore actual important system failures.
How can machine learning help with monitoring?
Machine learning can perform anomaly detection by learning normal system patterns and alerting only when behavior deviates significantly from that baseline.
What is the "lead time for changes" metric?
It measures how long it takes for a code change to go from commit to production, indicating the overall agility of the development pipeline.
Is centralized logging necessary?
Yes, it aggregates logs from all services into one searchable location, making it much faster to troubleshoot complex issues across distributed systems.
Can monitoring help with security?
Real-time security monitoring tracks access patterns and network traffic to detect and automatically respond to potential cyber threats or unauthorized access attempts.
What's Your Reaction?
 Like
0
 Dislike
0
 Love
0
 Funny
0
 Angry
0
 Sad
0
Sad
0
 Wow
0
Wow
0


![Kong Interview Preparation Guide [2025]](https://www.devopstraininginstitute.com/blog/uploads/images/202509/image_430x256_68dbb95326997.jpg)



![100+ Azure DevOps Interview Questions and Answers [Updated 2025]](https://www.devopstraininginstitute.com/blog/uploads/images/202509/image_140x98_68c40aa9a3834.jpg)


![90+ Git and GitHub Interview Questions [2025]](https://www.devopstraininginstitute.com/blog/uploads/images/202509/image_140x98_68c40a7931d60.jpg)


![Future Scope of DevOps Careers in Pune [Updated 2025]](https://www.devopstraininginstitute.com/blog/uploads/images/202510/image_140x98_68e3a84652312.jpg)


