


![Kong Interview Preparation Guide [2025]](https://www.devopstraininginstitute.com/blog/uploads/images/202509/image_430x256_68dbb95326997.jpg)


Monitoring & Logging in DevOps – Best Tools to Learn in Bangalore in 2025
Discover the most powerful monitoring and logging tools that every DevOps and SRE engineer in Bangalore must master in 2025 to land high-paying jobs. This guide covers Prometheus, Grafana, Loki, ELK Stack, OpenTelemetry, Jaeger and Alertmanager with practical examples and real production setups. Whether you are a beginner or switching careers, hands-on training at WebAsha Technologies, the leading DevOps Training Institute in Bangalore, gives you live cloud labs and real incident scenarios that make you completely job-ready in just weeks.
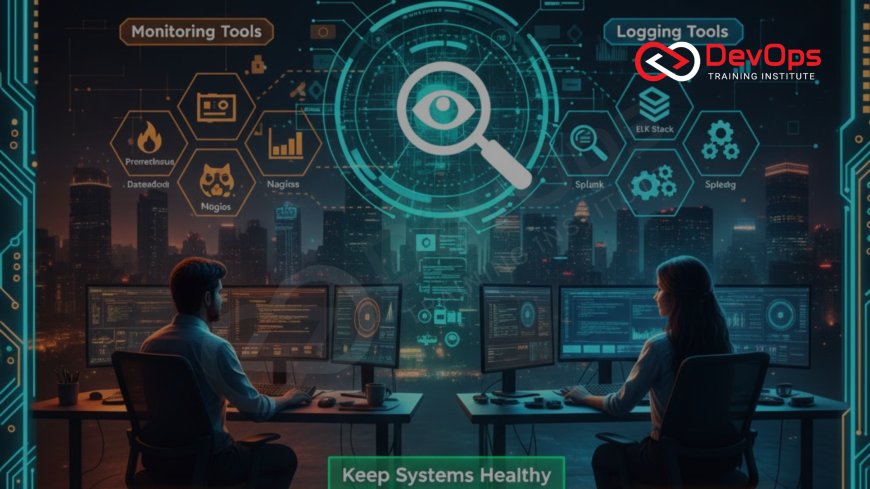
Building and deploying applications is important, but keeping them healthy in production is what separates average engineers from top talent. In Bangalore’s competitive job market, companies now reject candidates who cannot explain how they would detect and fix an outage within minutes. Monitoring and logging have become mandatory skills for every DevOps role.
The days of checking logs manually on servers are long gone. Modern systems are distributed across containers and clouds, generating millions of events every minute. Only proper observability tools can make sense of this chaos and help teams respond before customers even notice a problem.
Why Monitoring and Logging Are Non-Negotiable Skills Today
Applications today run as hundreds of microservices spread across multiple regions. A single slow database call can cascade into complete failure. Without real-time metrics, centralized logs and distributed traces, finding the root cause becomes impossible during incidents.
Bangalore companies follow strict 99.99% uptime targets. Missing a critical alert can cost lakhs in minutes. This is why senior roles demand deep knowledge of observability, and even freshers who know these tools get priority in hiring.
Top institutes like WebAsha Technologies dedicate full modules to these topics because interview panels spend more time on monitoring scenarios than on CI/CD questions.
Prometheus – The Heart of Modern Metrics Monitoring
Prometheus has become the undisputed leader for collecting and querying metrics in cloud-native environments. Almost every Kubernetes cluster in Bangalore runs Prometheus to monitor nodes, pods and custom application metrics.
Its pull-based architecture and powerful PromQL language make it perfect for dynamic workloads. You learn to write exporters, set up service discovery and create recording rules that power intelligent alerting.
Students at DevOps Training Institute practice scraping real Java and Python applications running inside Docker containers.
Grafana – Turning Raw Data into Actionable Insights
Collecting metrics is useless if nobody can understand them. Grafana solves this beautifully by creating stunning dashboards that even non-technical stakeholders love. You connect multiple data sources and build alerts with annotations.
Every engineer must know how to design dashboards that show golden signals: latency, traffic, errors and saturation. WebAsha Technologies makes every student build at least fifteen production-grade dashboards during the course.
Loki and Promtail – The Future of Cost-Effective Logging
Traditional ELK stack works well but becomes extremely expensive at scale. Grafana Loki has taken over Bangalore startups and mid-size companies because it indexes only labels, not full text, reducing storage cost by 90%.
Promtail runs as a lightweight agent that ships logs exactly like Prometheus scrapes metrics. The integration with Grafana is seamless, giving you one pane of glass for everything.
Learn more about monitoring importance in modern systems.
Tool Comparison – Choose the Right Stack for Your Career
Here is the comparison that every student at WebAsha Technologies refers to when planning their learning path:
| Tool | Best For | Bangalore Usage |
|---|---|---|
| Prometheus + Grafana | Metrics & Dashboards | 95% of Kubernetes setups |
| Grafana Loki | Cost-effective logs | Fastest growing |
| ELK Stack | Advanced search | Large enterprises only |
OpenTelemetry and Jaeger – Mastering Distributed Tracing
When latency spikes, metrics show the symptom but traces reveal the exact culprit service. OpenTelemetry has become the universal standard for instrumentation across all languages.
Jaeger provides beautiful flame graphs that make debugging microservices fun. You learn auto-instrumentation and manual spans in real polyglot applications.
This combination is now mandatory for senior and lead positions in Bangalore product companies.
Alertmanager – Smart Alerting That Reduces Fatigue
Too many alerts kill productivity. Alertmanager groups similar alerts, applies inhibition rules and routes them to correct teams via Slack, PagerDuty or email.
Writing noise-free alerting rules is an art that separates juniors from seniors. Students practice on-call scenarios with real pagers during training at WebAsha Technologies.
Complete Observability Platform You Will Build
During the course, you deploy the entire modern stack: Prometheus for metrics, Loki for logs, Jaeger for traces and Grafana as single dashboard. Everything runs on actual Kubernetes cluster with real traffic simulation.
This exact setup is running in hundreds of Bangalore companies today. Check which tools dominate 2025 job requirements.
Best Place to Learn Monitoring & Logging in Bangalore
WebAsha Technologies stands out as the most practical DevOps Training Institute in Bangalore because every student gets individual cloud accounts and builds production-grade observability from day one.
Trainers are active SREs from top product companies who share real incident war stories. Weekend and weekday batches suit both freshers and working professionals perfectly.
Conclusion
Monitoring and logging skills have become the biggest differentiator in Bangalore’s DevOps job market. Companies no longer hire engineers who can only deploy; they want people who can keep systems healthy 24/7.
The modern observability stack of Prometheus, Grafana, Loki and OpenTelemetry is here to stay for the next decade. Mastering it through hands-on training is the fastest way to jump from 8-10 LPA offers to 20+ LPA roles.
Start your journey today at WebAsha Technologies and become the engineer every team fights to hire.
Frequently Asked Questions
Which monitoring tool is most in demand in Bangalore?
Prometheus and Grafana combination is asked in 9 out of 10 interviews today.
Is Loki completely replacing ELK?
Not completely, but 80% of new projects in Bangalore now choose Loki for cost reasons.
Can freshers learn observability tools?
Yes, WebAsha Technologies starts from zero and makes freshers job-ready.
How long does it take to master these tools?
With daily labs, most students become confident in 4-6 weeks.
Do you provide cloud credits?
Yes, every student gets AWS/GCP credits worth thousands for practice.
Are weekend batches available?
Yes, both Saturday-Sunday and weekday evening options exist.
Will I learn alerting best practices?
Yes, real on-call scenarios with PagerDuty integration are included.
Is OpenTelemetry difficult?
Auto-instrumentation makes it very easy; manual spans need slight practice.
Do companies still use Nagios or Zabbix?
Only in very old setups. New projects completely avoid them.
Will I get placement assistance?
100% support with resume building and mock interviews focused on observability.
Should I learn monitoring before Kubernetes?
Better to learn basic Kubernetes first, then monitoring becomes meaningful.
Is Grafana certification available?
Official Grafana labs training is also provided at the institute.
Can I combine this with Python course?
Yes, many students join Python Training Institute module for writing custom exporters.
What salary can I expect?
Freshers with strong observability skills easily cross 15 LPA in Bangalore.
Do you provide recorded sessions?
Yes, lifetime access to all class recordings and lab materials.
What's Your Reaction?
 Like
0
Like
0
 Dislike
0
Dislike
0
 Love
0
Love
0
 Funny
0
Funny
0
 Angry
0
Angry
0
 Sad
0
Sad
0
 Wow
0
Wow
0

![100+ Azure DevOps Interview Questions and Answers [Updated 2025]](https://www.devopstraininginstitute.com/blog/uploads/images/202509/image_140x98_68c40aa9a3834.jpg)


![Future Scope of DevOps Careers in Pune [Updated 2025]](https://www.devopstraininginstitute.com/blog/uploads/images/202510/image_140x98_68e3a84652312.jpg)


