



46 Most Asked Dynatrace Interview Questions (2027)
46 most asked Dynatrace interview questions: OneAgent, Dynatrace Intelligence, OpenTelemetry, OpenPipeline, Monaco, Workflows and release checks.
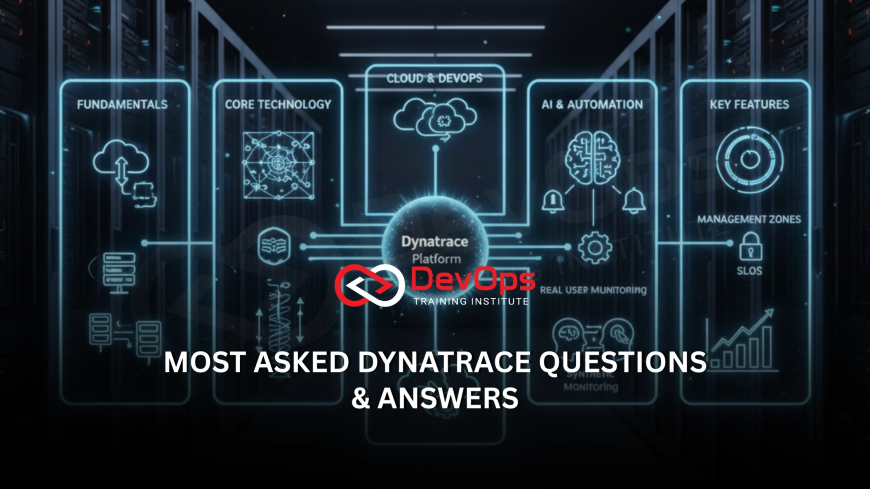
The most asked Dynatrace interview questions cover four areas: how OneAgent and Dynatrace Intelligence find a root cause, how you send data in through OpenTelemetry and OpenPipeline, how you manage configuration as code with Monaco or Terraform, and how you automate release checks with Workflows and Site Reliability Guardian. This page has 46 questions with short answers.
The answers were checked against the Dynatrace documentation in November 2026, including the 2026 rename of Davis AI to Dynatrace Intelligence.
Key takeaways
- Interviewers ask "explain the difference" questions more than definitions: OneAgent versus OpenTelemetry, metrics versus events versus logs in Grail, SLO versus guardian objective.
- Davis AI is now called Dynatrace Intelligence, and the Ask Davis CoPilot app is now Dynatrace Assist. Older names still appear in some APIs, so mention both.
- Management zones are being replaced by segments and IAM policies in the latest Dynatrace. Answers that only talk about management zones sound dated.
- Configuration as code (Monaco or the Terraform provider) is a frequent topic for DevOps roles, because teams expect dashboards, alerting and settings to live in Git.
- Scenario questions test your order of work: confirm impact, read the problem card, check the root cause entity, then act and prevent a repeat.
How this page differs from our other Dynatrace guide
Our 85+ Dynatrace interview questions guide goes deep on OneAgent installation, ActiveGate, Kubernetes deployment with the Dynatrace Operator, and DQL syntax. This page covers the questions candidates report hearing most in DevOps and SRE rounds: data ingest choices, configuration as code, automation, release validation and day-to-day troubleshooting. If you are newer to the topic, start with our explainer on observability versus traditional monitoring, then come back.
| Your experience | Read first | Practise |
|---|---|---|
| Fresher or career switcher | Questions 1 to 14 | Start a free Dynatrace trial, install OneAgent on a Linux VM and open the first problem it raises |
| 2 to 5 years | Questions 15 to 32 | Send OpenTelemetry traces from a sample app and write a DQL query over the spans |
| Senior | Questions 33 to 40 | Put alerting profiles and an SLO into a Monaco project and deploy it from a pipeline |
| Any level | Scenarios 41 to 46 | Talk through each one out loud in under three minutes |
Most asked Dynatrace questions for freshers
1. What is Dynatrace?
Dynatrace is a software intelligence and observability platform. It collects metrics, logs, traces, events, user sessions and security data, stores them in its Grail data lakehouse, maps how everything is connected, and uses Dynatrace Intelligence to detect problems and point to a root cause. It is offered mainly as SaaS, with a Managed option for customers who need to run the cluster themselves.
2. What does OneAgent do?
OneAgent is a single agent you install per host. It discovers processes, injects into supported runtimes such as Java, .NET, Node.js and Go to capture distributed traces, collects host and process metrics, and picks up logs. You do not install separate agents per technology, which is the main reason interviewers ask about it.
3. Which OneAgent monitoring modes exist?
Full-Stack mode gives code-level tracing plus infrastructure data. Infrastructure mode collects host, process and log data without deep application tracing. Discovery mode is a lightweight mode for broad coverage, available with the Dynatrace Platform Subscription and OneAgent 1.281 or later. You pick the mode per host based on what you need and what it costs.
4. What is ActiveGate used for?
ActiveGate is a proxy and extension host. It routes OneAgent traffic from networks that cannot reach the cluster directly, runs private synthetic monitors, polls cloud and platform APIs (for example Kubernetes or VMware), and runs extensions. Think of it as the bridge between your network and the Dynatrace cluster.
5. What is Smartscape?
Smartscape is the live topology map of your environment. It shows the vertical stack (data center, host, process, service, application) and the horizontal calls between services. Dynatrace Intelligence uses this map to follow a failure from a symptom to the component that caused it.
6. What is Dynatrace Intelligence, and what happened to Davis?
Dynatrace Intelligence is the current name of the AI engine that was called Davis. It combines learned baselines, topology and causal analysis to raise problems and rank root causes. At Perform 2026 Dynatrace renamed it, and the Ask Davis CoPilot app became Dynatrace Assist. Some API names and scopes still say "davis", so you will see both.
7. What is the difference between an event and a problem?
An event is a single detected anomaly, such as a CPU saturation event on one host or a failure rate increase on one service. A problem groups related events that share a root cause into one item with an impact analysis. You get notified about problems, so ten events from one database fault become one alert.
8. What is Grail?
Grail is the storage and query layer of the Dynatrace platform. It holds logs, metrics, spans, events and business events in buckets with defined retention, and you query all of them with the Dynatrace Query Language (DQL). Interviewers want to hear that you can query different data types in one language without defining an index first.
9. What does a basic DQL query look like?
DQL is a pipeline of commands joined by pipes. A typical log query fetches a data type, filters, then summarizes:
fetch logs
| filter loglevel == "ERROR"
| summarize count(), by:{k8s.namespace.name}
| sort `count()` desc
Know fetch, filter, fields, summarize, sort and limit, and know that metrics use the timeseries command instead of fetch.
10. What is Real User Monitoring (RUM)?
RUM measures what real users experience in a browser or mobile app. For web apps, OneAgent can inject the RUM JavaScript automatically, or you add the tag manually when OneAgent cannot reach the web server. You get page load timings, user actions, errors, sessions and, where enabled and allowed by your privacy settings, Session Replay.
11. What is synthetic monitoring, and how is it different from RUM?
Synthetic monitors run scripted checks on a schedule from public or private locations. HTTP monitors check endpoints; browser monitors replay a click path in a real browser. RUM tells you what happened to real visitors, while synthetic tells you whether a path works even when no one is using it, for example at 3 a.m. or before launch.
12. What is a service in Dynatrace?
A service is a detected entry point that handles requests, such as a web request handler, a gRPC endpoint or a database that is called by your code. Dynatrace tracks response time, failure rate and throughput per service and builds the service flow from traces. Services are the level most alerts and SLOs are built on.
13. Where do you see why a request was slow?
Open the distributed trace for the request. The trace shows each span across services, time spent in code, database calls and external calls. For hot code paths you can look at method hotspots in the service view. Interviewers like candidates who say they would compare a slow trace to a normal one.
14. What is a host group?
A host group is a label you assign to OneAgent at install time (for example with the --set-host-group option) to group hosts that share a purpose, such as payments-prod. Settings like anomaly detection thresholds and process monitoring rules can be applied per host group, so it keeps configuration consistent across similar machines.
Most asked Dynatrace questions for 2 to 5 years of experience
15. When would you use OpenTelemetry instead of OneAgent?
Use OpenTelemetry when OneAgent cannot run or cannot instrument the workload: serverless functions, unsupported languages, managed platforms where you cannot install agents, or when the team has already instrumented code with OTel SDKs. Dynatrace accepts OTLP traces, metrics and logs. Many teams mix both: OneAgent where it is supported and OTel for the rest.
16. How do you send OpenTelemetry data to Dynatrace?
Send OTLP over HTTP to the Dynatrace OTLP API endpoint for your environment with an API token that has the right ingest scopes, either directly from the SDK or through an OpenTelemetry Collector. The Collector is the usual choice in production because it batches, retries and can filter or enrich data before it leaves your network.
17. What is OpenPipeline?
OpenPipeline is the Dynatrace processing layer for data at ingest. You define rules that parse, filter, mask, enrich and route records (for example logs or events) into buckets before they are stored. It replaced older log processing rules, so if an interviewer asks how to drop debug logs or mask card numbers on the way in, OpenPipeline is the answer.
18. How do you collect Prometheus metrics in Kubernetes?
Annotate pods or services with metrics.dynatrace.com/scrape: "true" plus the port and path annotations, and Dynatrace scrapes the endpoint through ActiveGate. For new setups Dynatrace also recommends the OpenTelemetry Collector with a Prometheus receiver. Either way, mention that you keep high-cardinality labels in check because they drive cost.
19. What are metric events, and how are they different from built-in anomaly detection?
Built-in anomaly detection learns baselines for services, applications and infrastructure automatically. Metric events (and custom anomaly detectors in the latest platform) let you define your own condition on any metric, such as a static threshold on queue length or an auto-adaptive baseline on a business metric. Use them for signals Dynatrace does not baseline out of the box.
20. How do alerting profiles and problem notifications work together?
An alerting profile filters which problems matter, by severity, by tags or entities, and by how long a problem has been open. A problem notification (for example to PagerDuty, Slack, email or a webhook) uses an alerting profile to decide what to send. This split lets one team get only critical production problems while another gets everything for its own services.
21. What are tags used for, and how do you apply them at scale?
Tags label entities for filtering, alerting, dashboards and access. Apply them automatically with auto-tagging rules based on properties such as Kubernetes namespace, host group or cloud tags, rather than by hand. In Kubernetes, labels and annotations can also become tags or entity properties, which keeps ownership data close to the deployment.
22. What replaced management zones?
In the latest Dynatrace, segments filter data in apps and queries, and IAM policies with security context and Grail buckets control who can see which data. From SaaS version 1.349, management zone conditions in IAM policies no longer match. Saying you know about this migration shows you have used the current platform.
23. What is a Dynatrace Workflow?
A Workflow is an automation in the AutomationEngine. It starts from a trigger (an event such as a new problem, a schedule, or a manual run) and runs a chain of tasks: DQL queries, JavaScript, HTTP calls, or actions from integrations such as Slack, Jira or Kubernetes. Typical uses are enriching a problem with context, opening a ticket, or running a remediation step.
24. What is Site Reliability Guardian?
Site Reliability Guardian (SRG) validates a release against objectives you define, such as error rate, response time or a DQL query result, and returns pass, warning or fail. You usually trigger it from a pipeline or a Workflow after deployment, and the pipeline promotes or rolls back based on the result.
25. How is an SLO different from a guardian objective?
An SLO tracks a reliability target over a time window (for example 99.9% successful requests over 30 days) and shows how much error budget is left. A guardian objective is a check at a moment in time, usually just after a change. SLOs answer "are we reliable for users?"; guardian checks answer "did this release make it worse?"
26. How do you send deployment information to Dynatrace?
Send a deployment or SDLC event from the pipeline through the API, with the version, the pipeline run link and the affected entities or tags. Dynatrace then shows the deployment on the timeline and can link a later problem to it. This is the right answer to "how do you monitor Jenkins deployments"; installing OneAgent on the Jenkins server only monitors Jenkins itself.
27. How do you monitor a cloud provider account?
Connect the account through the cloud integration (for example AWS, Azure or Google Cloud), which pulls managed service metrics and metadata through the provider APIs. Add OneAgent or OTel for workloads where you need traces. Mention that you choose which services to collect, because each one adds metrics and cost.
28. What is the Dynatrace Hub?
The Hub is the catalog of supported technologies, extensions and apps in your environment. You use it to find and enable an extension (for example for a database or network device) or to install apps on the platform. In an interview, mention it when asked how you would monitor a technology OneAgent does not cover.
29. How does Dynatrace Application Security work?
It uses OneAgent data to find vulnerable third-party libraries and code-level vulnerabilities in running processes, and to detect and optionally block certain attacks at runtime. Because it knows which processes are actually running and exposed, it can rank vulnerabilities by real exposure rather than listing every finding from a static scan.
30. What are business events?
Business events carry business data such as an order value, a booking ID or a checkout step. You capture them from requests through OneAgent rules, from RUM, or by sending them through the API, and you query them in Grail with DQL. They let you tie a technical problem to business impact, for example lost orders during a slow period.
31. How do you create a dashboard or notebook that the team will use?
Build it on DQL queries so it reads from Grail, filter it with segments or variables per team or environment, and keep it small: one question per tile. Notebooks suit investigations and runbooks with explanatory text; dashboards suit a wall view. Store important ones as code so changes are reviewed.
32. How do you control log ingest cost?
Decide what to ingest at the source, drop or sample noisy logs in OpenPipeline, route data to buckets with shorter retention where you can, and avoid extracting high-cardinality fields you do not query. Then review consumption regularly. Interviewers want a process, not a single trick.
Most asked Dynatrace questions for senior roles
33. How do you manage Dynatrace configuration as code?
Use Monaco (the Dynatrace configuration as code CLI) or the Dynatrace Terraform provider. Store settings such as alerting profiles, anomaly detection, auto-tags, SLOs, dashboards and Workflows in Git, review changes in pull requests, and deploy them from a pipeline to each environment. Click-ops changes in production are then detected and reverted on the next deploy.
34. What does a Monaco project contain, and how do you deploy it?
A Monaco project has a manifest.yaml that lists projects and target environments with their URLs and token references, plus folders of configuration files that combine a YAML definition with a JSON template. You deploy it with:
monaco deploy manifest.yaml --environment prodRun --dry-run first in the pipeline to validate before you apply.
35. Monaco or Terraform: how do you choose?
Pick Terraform if the team already manages cloud infrastructure with Terraform and wants one workflow and state model. Pick Monaco if the Dynatrace team wants a tool built for Dynatrace configuration with templating across many environments and no state file. Both work; the wrong answer is to use both for the same settings.
36. How would you design access control for a large organization?
Use groups mapped from your identity provider through SAML or SCIM, IAM policies that grant permissions on buckets and security context, and segments so each team sees its own slice by default. Keep a small admin group, give read access widely, and grant write access to settings only through the configuration as code pipeline.
37. How do you roll out OneAgent across thousands of hosts safely?
Automate the install with your configuration management tool or golden images, set host groups and tags at install, roll out in waves starting with non-production, and control OneAgent update windows so updates do not hit all hosts at once. On Kubernetes, use the Dynatrace Operator with a DynaKube resource and version control that file.
38. How do you reduce alert noise?
Start from problems rather than events, tune alerting profiles by severity and delay, fix or mute entities that should not alert (for example batch hosts with expected CPU spikes), use metric events only for signals that need action, and review which problems were closed without action each week. Measure the ratio of actionable pages over time.
39. How do you connect Dynatrace to an incident management tool?
Use the built-in problem notification integration (for example PagerDuty, ServiceNow or Opsgenie, depending on what the company runs) or a Workflow that calls the tool's API. Send the problem ID, impact, root cause entity and a link back, and make sure problem closure resolves the incident so on-call does not chase closed problems.
40. How would you build a release gate in a CI/CD pipeline?
After deployment, the pipeline sends a deployment event, waits for a soak period, triggers a Site Reliability Guardian validation, and reads the result. Pass promotes, fail rolls back and notifies the team. Keep objectives few and tied to user impact: error rate, latency percentiles and one key business event.
Scenario-based Dynatrace interview questions
41. A problem says "Response time degradation" on checkout. What do you do?
Open the problem card, confirm the impact (affected users and services), and read the root cause entity. Check whether a deployment event sits on the timeline just before the problem started. Compare slow traces with normal ones to find the span that grew. If a release caused it, roll back first and investigate after.
42. A Kubernetes workload shows no traces after a redeploy. How do you troubleshoot?
Check the DynaKube status and Operator logs, confirm the namespace is selected for injection, and look at the pod for the init container or webhook injection. If the pod started before the webhook was ready, restart it. Also confirm the runtime is supported in the chosen monitoring mode.
43. Log ingest volume doubled overnight. What steps do you take?
Query ingest by source with DQL to find which namespace, host or log source grew. Check whether a deployment turned on debug logging. Ask the owning team to fix the source, and as a short-term guard add an OpenPipeline rule to drop or sample that source. Then add an alert on ingest volume per source.
44. On-call says Dynatrace pages them for problems that fix themselves. How do you respond?
Pull the list of problems closed within a few minutes and group them by type and entity. For each group, decide whether to raise the threshold, add a delay in the alerting profile, fix the root cause, or stop alerting on that entity. Agree the changes with the team and push them through configuration as code.
45. A guardian check failed but the team says the release is fine. What do you do?
Look at which objective failed and whether the comparison window was fair: low traffic right after deploy can skew error rates. Check the data, then either fix the release or adjust the objective with the team's agreement. Do not bypass the gate silently, because a gate people ignore protects nothing.
46. Leadership asks whether a slow week hurt revenue. How do you answer with Dynatrace?
Use business events for orders or revenue and join them in DQL with service response time or failure rate over the same period. Show conversion rates during slow periods against normal periods. State what the data shows and what it cannot prove, such as other causes of lower sales.
How to prepare for a Dynatrace interview
- Use a free trial environment and install OneAgent on one VM and one small Kubernetes cluster.
- Write ten DQL queries over logs, spans and metrics until you can write them without the docs.
- Send traces from a sample app through an OpenTelemetry Collector.
- Create one alerting profile, one SLO and one Workflow, then export them with Monaco.
- Practise the scenario answers above out loud.
Monitoring questions often sit next to general observability questions. Our observability tools comparison and the New Relic interview questions help if the company runs more than one tool. For a short FAQ-style refresher, see Dynatrace FAQs asked in DevOps interviews, and for wider prep the 200+ DevOps interview questions hub. If you want structured practice with Prometheus, Grafana and alerting before moving to a commercial platform, see our Prometheus and Grafana training, available in our Kharadi, Pune classroom and live online.
Official references
- Dynatrace Intelligence documentation
- Dynatrace AI naming (Dynatrace Intelligence, Dynatrace Assist)
- OneAgent monitoring modes
- OTLP API ingest
- Monitor Prometheus metrics in Kubernetes
- Upgrade guide: management zones to segments
- Site Reliability Guardian
- Service-level objectives
- Configuration as code (Monaco and Terraform)
- Application Security
FAQs
Is Davis AI still part of Dynatrace?
The engine still exists under a new name. Dynatrace renamed Davis AI to Dynatrace Intelligence at Perform 2026, and Ask Davis CoPilot became Dynatrace Assist. Some API names still use "davis".
Do I need to know DQL for a Dynatrace interview?
Yes, for most DevOps and SRE roles. Be able to fetch logs or spans, filter, summarize by a field and use timeseries for metrics. Interviewers often ask you to write a short query on a whiteboard.
Should I learn OneAgent or OpenTelemetry first?
Learn OneAgent first because most Dynatrace environments rely on it, then learn how to send OTLP data for workloads where OneAgent cannot run.
Are management zones still asked about?
Sometimes, because many environments still use them. Explain them, then say that segments and IAM policies replace them in the latest Dynatrace.
What is the difference between Monaco and the Terraform provider?
Both manage Dynatrace configuration as code. Monaco is built for Dynatrace and needs no state file; Terraform fits teams that already run Terraform for infrastructure.
Is there an official Dynatrace certification?
Dynatrace runs its own training and certification program through Dynatrace University. Check the official Dynatrace site for the current tracks, because names and levels change.
How many Dynatrace questions should I prepare?
Prepare the 46 on this page well rather than memorising hundreds. Most rounds go deep on five to ten topics and one or two scenarios.
What's Your Reaction?
 Like
0
 Dislike
0
 Love
0
 Funny
0
 Angry
0
 Sad
0
 Wow
0