Top 10 Monitoring Practices for High Availability
Achieve true high availability in 2025 with these 10 battle-tested monitoring practices used by Netflix, Google, and top-tier SRE teams. Learn how to implement golden signals, meaningful SLOs, distributed tracing, chaos engineering, automated alerting, and self-healing systems that keep your services up even during major outages.
Introduction
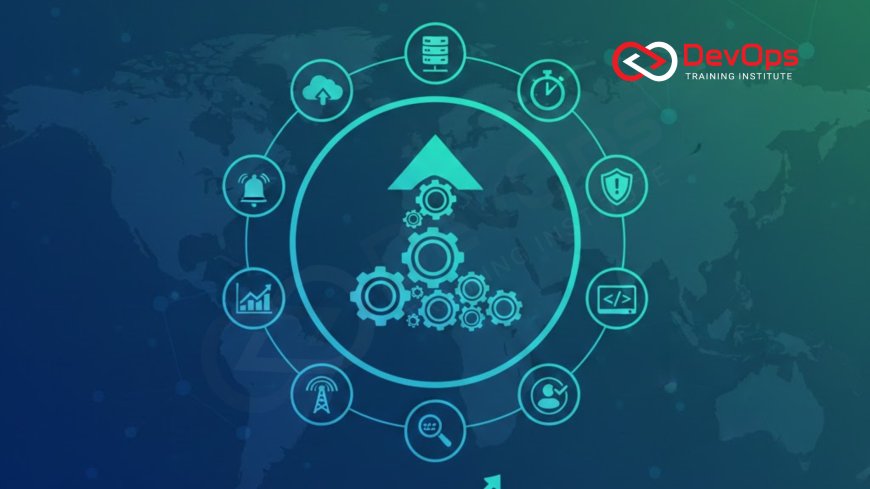
High availability is not about preventing failures; it’s about detecting and recovering from them faster than customers notice. In 2025, the best engineering teams treat monitoring as a core engineering discipline, not an afterthought. These 10 practices separate systems that achieve 99.99%+ uptime from those that suffer frequent outages and long recovery times.
1. Monitor the Four Golden Signals
Google’s SRE book made this famous for good reason. Every service must be monitored across four critical dimensions:
- Latency: How long requests take (including errors)
- Traffic: Demand on the system
- Errors: Rate of failed requests
- Saturation: How full resources are (CPU, memory, disk)
These four metrics tell you 95% of what you need to know about service health.
2. Define and Track Meaningful SLOs
Service Level Objectives (SLOs) are the cornerstone of modern reliability. Instead of chasing “100% uptime,” define realistic, customer-focused targets like “99.9% of API requests complete under 200ms.”
| Component | Example SLO | Error Budget |
|---|---|---|
| Frontend | 99.95% page loads < 2s | 21 minutes/month |
| API | 99.9% requests < 400ms | 43 minutes/month |
| Database | 99.99% queries < 100ms | 4.3 minutes/month |
3. Implement Distributed Tracing End-to-End
Logs and metrics aren’t enough in microservices. Distributed tracing (OpenTelemetry) shows the complete path of a request across dozens of services. When a customer reports slowness, you can trace exactly which service and database call caused it.
4. Use Redundancy-Aware Alerting
Never alert on single instance failure. Only alert when availability or performance actually degrades for users.
- Alert when >50% of replicas are down
- Alert on SLO burn rate (e.g., burning 10% of monthly budget in 1 hour)
- Use advanced monitoring to detect read replica lag before it affects users
5. Build Self-Healing Systems
The best monitoring doesn’t just notify humans; it fixes problems automatically.
- Kubernetes liveness/readiness probes restart failed pods
- Auto-scaling replaces unhealthy instances
- Circuit breakers prevent cascading failures
- Chaos engineering verifies self-healing works
6. Implement Chaos Engineering Regularly
Netflix’s Chaos Monkey taught us: if a failure will cause an outage, find it in daylight on Tuesday, not at 3 AM Sunday. Run regular chaos experiments:
- Terminate random instances
- Inject network latency
- Fail database connections
- Simulate DNS failures
7. Centralize Logs with Proper Context
Every log line should include trace ID, request ID, customer ID, and environment. Use structured logging (JSON) and ship to a central system (Loki, ELK, Datadog) with long-term retention.
8. Create Actionable Runbooks
Every alert must have a runbook with:
- Symptoms and impact
- Step-by-step diagnosis commands
- Safe mitigation steps
- When to escalate
Store runbooks in Git alongside code for version control.
9. Monitor the Monitors
Monitoring systems fail too. Implement:
- Dead man’s switch alerts if monitoring stops reporting
- Separate monitoring for monitoring infrastructure
- Automated tests that verify alerts fire correctly
10. Practice Blameless Post-Mortems
Every incident is a learning opportunity. Conduct blameless post-mortems focused on:
- What happened (timeline)
- Why it happened (root causes)
- How to prevent recurrence
- Action items with owners and dates
This culture of continuous improvement is what separates 99.9% uptime from 99.99%.
Conclusion
High availability in 2025 isn’t about buying expensive hardware or perfect code. It’s about building systems that expect failure and handle it gracefully. These 10 monitoring practices create a flywheel: better observability leads to faster detection, which enables automated recovery, which builds confidence to move faster, which generates more data for better observability. Companies that master this cycle achieve not just high availability, but the ability to innovate rapidly without fear. The best part? These practices scale down to startups and up to hyperscalers. Start with golden signals and SLOs today, and build from there.
Frequently Asked Questions
What’s more important: monitoring or observability?
Observability. Monitoring tells you when something is wrong; observability tells you why.
How many alerts should a team have?
Less than 10 pages per team per week. More than that means alert fatigue.
Should we monitor infrastructure or applications?
Both, but prioritize application-level metrics that directly impact users.
What’s a good SLO for a new service?
Start with 99.5–99.9% and tighten as you gain confidence.
How often should we run chaos experiments?
At minimum monthly. Best teams run them continuously in production.
What's Your Reaction?
 Like
0
 Dislike
0
 Love
0
 Funny
0
 Angry
0
 Sad
0
Sad
0
 Wow
0
Wow
0


![Kong Interview Preparation Guide [2025]](https://www.devopstraininginstitute.com/blog/uploads/images/202509/image_430x256_68dbb95326997.jpg)


![100+ Azure DevOps Interview Questions and Answers [Updated 2025]](https://www.devopstraininginstitute.com/blog/uploads/images/202509/image_140x98_68c40aa9a3834.jpg)


![90+ Git and GitHub Interview Questions [2025]](https://www.devopstraininginstitute.com/blog/uploads/images/202509/image_140x98_68c40a7931d60.jpg)


![Future Scope of DevOps Careers in Pune [Updated 2025]](https://www.devopstraininginstitute.com/blog/uploads/images/202510/image_140x98_68e3a84652312.jpg)


