


![Kong Interview Preparation Guide [2025]](https://www.devopstraininginstitute.com/blog/uploads/images/202509/image_430x256_68dbb95326997.jpg)


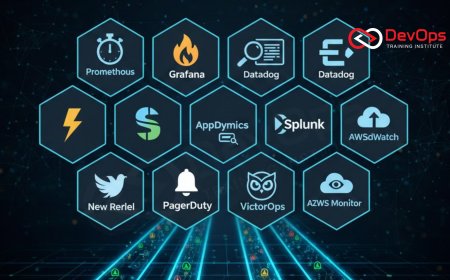
10 API Monitoring Tools DevOps Teams Love
Discover the 10 essential API monitoring tools favored by DevOps Teams for maintaining the health, performance, and reliability of microservices and distributed applications. This guide covers commercial platforms like Datadog and New Relic, alongside powerful open-source solutions like Prometheus and Jaeger. Learn how these tools provide deep observability into API latency, error rates, and throughput, enabling proactive alerting, faster root cause analysis, and the assurance that critical services meet demanding Service Level Objectives (SLOs), which is vital for modern cloud-native architecture relying on fast and stable internal communication.
Introduction
In the modern cloud-native landscape, monolithic applications have been dismantled and replaced by ecosystems of interconnected microservices, all communicating via Application Programming Interfaces, or APIs. These APIs are the true nervous system of the distributed application, handling everything from user authentication to database queries. When an API fails, the entire application suffers, leading to outages, degraded performance, and immediate customer dissatisfaction. For DevOps Teams and Site Reliability Engineers (SREs), monitoring API health is no longer a niche requirement; it is the single most critical function for ensuring application reliability and meeting demanding Service Level Objectives (SLOs).
A manual approach to API monitoring is impossible at scale. Instead, teams rely on specialized monitoring and observability tools that automatically collect, analyze, and visualize data on API performance. These tools must provide comprehensive insights into latency (how fast the API responds), throughput (how many requests it handles), and error rates, not just for external APIs, but for the complex web of internal service-to-service communication. The adoption of these sophisticated platforms is a necessary investment in the resilience and continuous uptime of the distributed application, forming the core of any proactive DevOps observability strategy that spans across infrastructure, whether virtualized or running on operating systems like Linux.
This guide delves into the 10 best API monitoring tools that have become indispensable to DevOps Teams. We examine solutions that range from open-source powerhouses that provide maximum customization to all-in-one commercial platforms that offer integrated, machine learning-driven analysis, all united by their ability to provide the deep, actionable insights required for maintaining service health and accelerating the process of root cause analysis when incidents inevitably occur.
The Titans of Open Source Observability
Open-source tools provide the ultimate flexibility and control over the monitoring stack, often eliminating licensing costs entirely and allowing DevOps Teams to customize data collection and alerting precisely to their unique operational needs. These tools are the foundation of many high-scale, modern monitoring architectures, particularly those built on Kubernetes, where the principles of community-driven development that drove the evolution of technologies like Linux are highly valued.
1. Prometheus: The de facto open-source standard for collecting time-series metrics. Prometheus excels at monitoring API endpoints by scraping exposed metrics (e.g., request duration, error counts, number of concurrent requests) and providing a powerful query language (PromQL) for defining custom aggregation and alerting rules. It is crucial for understanding the current health and performance of the API service, allowing teams to set up proactive alerts based on defined thresholds that are far more sensitive than simple server uptime checks.
2. Grafana: While not a monitoring tool itself, Grafana is the essential visualization layer that pairs seamlessly with Prometheus (and many other data sources). DevOps Teams use Grafana to build comprehensive, shared dashboards that display API latency, error rates, and service-level indicators (SLIs) in real-time. This provides a centralized "single pane of glass" view, ensuring that developers and SREs have immediate, consistent access to the performance data required for rapid decision-making during production incidents and performance tuning exercises.
3. Jaeger: A powerful open-source tool for distributed tracing, which is indispensable for diagnosing issues in microservices architectures. Jaeger tracks the flow of a single user request as it traverses multiple services and API calls, providing a visual map of the entire transaction path. This allows engineers to instantly identify which specific service or API call introduced latency or failed within a complex, multi-hop workflow, dramatically reducing the time spent on root cause analysis. This tracing ability is crucial for optimizing end-to-end API performance.
Commercial Full-Service APM Platforms
Commercial Application Performance Monitoring (APM) platforms provide all three pillars of observability—metrics, logs, and tracing—in a single, integrated offering, often enhanced with machine learning for automated anomaly detection and predictive alerting. These platforms are highly valued by large enterprises and DevOps Teams for their ease of setup, unified user experience, and comprehensive, out-of-the-box analysis capabilities, reducing the operational toil associated with managing a complex open-source monitoring stack.
4. Datadog: A leading, all-in-one observability platform that provides deep API monitoring capabilities by integrating metrics, logs, and distributed tracing into one cohesive solution. Datadog offers synthetic monitoring (simulating external user requests) and real-user monitoring (RUM) for external APIs, alongside code-level tracing for internal microservices. Its machine learning features automatically detect performance anomalies and correlate API errors with underlying infrastructure events, accelerating Mean Time to Resolution (MTTR) significantly.
5. New Relic: Another pioneer in the APM space, New Relic provides robust API performance monitoring that gives teams full visibility into application behavior, database calls, and transaction health. Its platform excels at detailed, code-level analysis, allowing developers to drill down from a high API latency alert directly into the specific lines of code or database query that caused the bottleneck. This deep-dive capability is essential for optimizing specific service endpoints and ensuring code efficiency.
6. Dynatrace: Known for its AI-powered approach ("Davis"), Dynatrace provides automated monitoring of APIs and microservices with root cause analysis delivered directly by its intelligence engine. It automatically discovers and maps all dependencies within the distributed system, making it incredibly effective at diagnosing issues in complex, dynamic cloud environments. Its ability to simplify dependency mapping across thousands of internal APIs is a huge time-saver for DevOps Teams managing rapidly evolving architectures.
Synthetic and External Monitoring Solutions
Monitoring the external user experience is vital, and synthetic monitoring provides a way to simulate user behavior by running automated, scripted API calls from outside the infrastructure. This testing ensures that the API gateway, network path, and core endpoints are consistently available and meeting latency targets from the perspective of the actual user, regardless of where they access the service.
7. Postman (Monitors): While primarily known as an API development and testing tool, Postman offers a highly accessible cloud monitoring service (Postman Monitors). DevOps Teams can take their existing API test collections—which already define authentication, request bodies, and expected responses—and schedule them to run automatically from various global locations. This provides a simple, yet powerful way to perform synthetic monitoring of public and external API endpoints and track historical performance.
8. Pingdom/UptimeRobot: These tools specialize in simple, external availability monitoring. They are essential for confirming that the primary API gateway or public-facing service is responding correctly from multiple geographic locations. While they do not offer deep code tracing, they provide reliable, global checks on uptime and basic response time, often serving as the first line of defense for verifying that an API is accessible and providing the correct status code to end-users and client applications.
Log and Event Correlation Tools
API monitoring generates two main types of data: quantitative metrics (latency, throughput) and qualitative logs (stack traces, error messages). The most effective tools correlate these two data streams, allowing engineers to quickly jump from an alert (e.g., "Error rate > 5%") directly to the specific log messages and traces that caused the error, greatly accelerating diagnosis. This correlation is crucial when dealing with complex, multi-service workflows running on dynamic environments.
9. Splunk/ELK Stack (Elasticsearch, Logstash, Kibana): These platforms are the industry standards for centralized log management. Logs from all microservices, API gateways, and infrastructure components are aggregated and indexed here, allowing DevOps Teams to search, filter, and analyze qualitative error data rapidly. The ability to correlate unique API request IDs found in the application logs with performance spikes seen in Prometheus or Grafana is the final puzzle piece in effective root cause analysis, proving the value of centralized log management for diagnosing system issues.
10. OpenTelemetry: While not a single tool, OpenTelemetry (OTel) is a set of vendor-neutral APIs, SDKs, and tools for capturing the three pillars of observability—metrics, logs, and traces—from application code. DevOps Teams love OTel because it standardizes instrumentation, allowing them to collect rich API data once and send it to any backend (like Jaeger, Prometheus, Datadog, or Splunk) without having to rewrite their code. This future-proofs the monitoring strategy and reduces vendor lock-in, aligning perfectly with the flexible nature of cloud-native development.
API Monitoring Best Practices for DevOps Teams
Successful API monitoring is defined by a rigorous set of best practices that institutionalize reliability and resilience across the organization. Merely installing a tool is insufficient; the key is using the data to drive continuous improvement and ensure that all services meet their contractual obligations to clients and other internal microservices. These practices are non-negotiable for high-performing DevOps Teams focused on operational excellence.
- Define Clear SLOs: Monitoring should be governed by Service Level Objectives (SLOs), not vague performance goals. Define SLOs based on what matters to the user (e.g., "95% of API requests must return in less than 200ms"), and use monitoring tools to alert immediately when these thresholds are violated.
- Instrument All Service-to-Service Calls: In a microservices architecture, internal API calls are as important as external ones. Use distributed tracing (Jaeger or commercial APM) to monitor every internal call, identifying latency bottlenecks deep within the application's core workflow.
- Automate Synthetic Tests: Use tools like Postman or Pingdom to run scripted API transaction checks from various global regions frequently. This simulates the external user experience and provides validation of end-to-end functionality, ensuring the entire system is healthy from the outside in.
- Integrate CI/CD Gates: Integrate API performance checks into the Continuous Delivery (CD) pipeline. A deployment should only be promoted to production if it passes automated load tests and performance benchmarks in the staging environment, preventing known regressions from ever reaching the live service.
- Correlate the Three Pillars: Ensure that your metrics (Prometheus), logs (Splunk), and traces (Jaeger) are all correlated via a common transaction ID (trace ID). This allows engineers to move seamlessly from a high-level performance alert to the specific error message and line of code that caused the failure, accelerating MTTR.
Conclusion
The health of an application in the cloud is directly tied to the performance of its APIs. For DevOps Teams, the mastery of API monitoring tools is essential for ensuring resilience, high availability, and customer satisfaction in a world built on microservices. Whether choosing the powerful, customizable open-source stack (Prometheus, Grafana, Jaeger) or the integrated simplicity of commercial APM solutions (Datadog, New Relic), the strategic focus remains the same: gather deep, actionable data.
By implementing these tools and the associated best practices—defining clear SLOs, correlating logs and metrics, and instituting synthetic monitoring—DevOps Teams transform their operational model from reactive firefighting to proactive, data-driven system management. This continuous dedication to observability is what enables modern enterprises to maintain maximum velocity and reliability, ensuring that every service, no matter how small, contributes positively to the overall performance of the distributed system.
Frequently Asked Questions
What is the difference between Prometheus and Grafana?
Prometheus collects and stores time-series metrics, while Grafana provides the visualization layer, creating dashboards and graphs from the Prometheus data.
What is distributed tracing used for?
Distributed tracing is used to track the flow of a single request across multiple interconnected microservices, identifying which API call introduced latency or failed.
Why is synthetic monitoring important for APIs?
Synthetic monitoring is important because it simulates external user traffic from various global locations, ensuring the API is available and fast from the user's perspective.
What are the three pillars of observability?
The three pillars are Metrics (quantitative data on performance), Logs (qualitative data on events and errors), and Traces (the path of a request through the system).
How does API monitoring relate to SLOs?
API monitoring tools collect the metrics (SLIs) that are used to measure the API's performance against its predetermined Service Level Objectives (SLOs) for speed and error rates.
What does APM stand for?
APM stands for Application Performance Monitoring, referring to the tools and practices used to monitor the performance and health of application code and APIs.
How does Postman help with monitoring?
Postman helps by allowing DevOps Teams to schedule their existing API development test collections to run automatically from the cloud as synthetic monitors.
Why should logs and metrics be correlated?
Logs and metrics should be correlated to allow engineers to move directly from a performance alert (metric) to the specific error message (log) that caused the problem.
What is OpenTelemetry?
OpenTelemetry is a set of open-source standards and SDKs for collecting metrics, logs, and traces from application code, ensuring vendor-neutral monitoring.
What is the benefit of a commercial APM like Datadog over open source?
Commercial APM provides easier setup, integrated correlation of all three pillars, and AI-driven anomaly detection out-of-the-box, reducing operational complexity.
What is the primary function of New Relic's deep analysis?
New Relic's deep analysis allows engineers to drill down from a high API latency alert to identify the specific code function or database query responsible for the slowdown.
How does Dynatrace use AI in API monitoring?
Dynatrace uses AI to automatically discover and map dependencies within the distributed system and provide precise root cause analysis for API performance incidents.
Why is internal API monitoring important?
Internal API monitoring is important because service-to-service calls are the most frequent transactions; a failure in one internal API can trigger a cascading failure across the entire application.
Which API monitoring tool is built for distributed tracing?
Jaeger is the key open-source monitoring tool specifically built for visualizing and debugging transaction paths across distributed microservices via tracing.
How does API monitoring help with continuous deployment?
API monitoring helps with continuous deployment by providing automated health checks and performance gates, ensuring new versions are only fully deployed if post-release API performance is stable.
What's Your Reaction?
 Like
0
Like
0
 Dislike
0
Dislike
0
 Love
0
Love
0
 Funny
0
Funny
0
 Angry
0
Angry
0
 Sad
0
Sad
0
 Wow
0
Wow
0
![100+ Azure DevOps Interview Questions and Answers [Updated 2025]](https://www.devopstraininginstitute.com/blog/uploads/images/202509/image_140x98_68c40aa9a3834.jpg)


![Future Scope of DevOps Careers in Pune [Updated 2025]](https://www.devopstraininginstitute.com/blog/uploads/images/202510/image_140x98_68e3a84652312.jpg)


