10 DevOps Alerting Tools to Detect Issues Early
In the high-pressure software landscape of 2026, detecting issues early is the only way to maintain the 99.99% uptime users expect. This guide identifies ten essential DevOps alerting tools that empower engineering teams to bridge the gap between reactive firefighting and proactive system governance. Learn how to leverage AI-driven anomaly detection, automated incident response, and smart notification routing to reduce alert fatigue and accelerate recovery. Whether you are managing complex microservices or global cloud clusters, these tools provide the technical foundation for a resilient and observable infrastructure that protects your digital business and ensures a seamless experience for every user today.
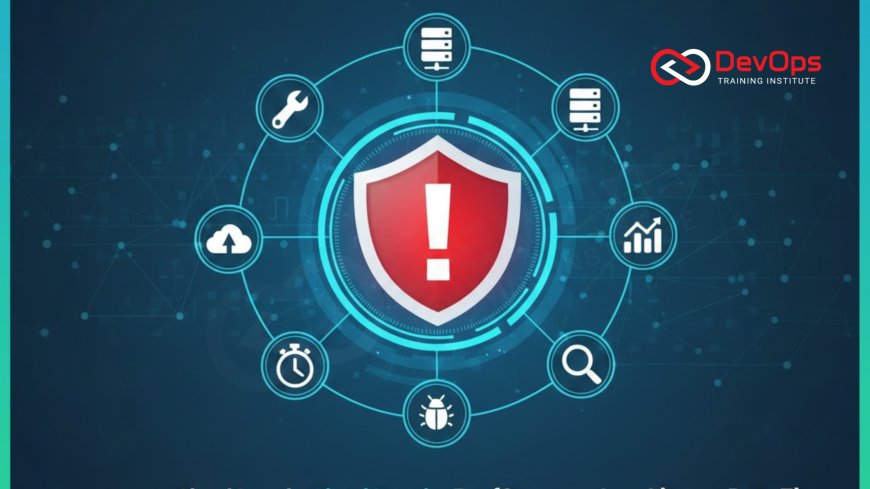
Introduction to Proactive DevOps Alerting
Modern software delivery is a race against time and complexity. As organizations shift toward microservices and multi-cloud architectures, the number of potential failure points grows exponentially. Alerting is the sensory system of DevOps; it is the mechanism that notifies engineers the moment a system deviates from its healthy state. In 2026, simply knowing "something is broken" is no longer enough. High-performing teams require tools that provide deep context, eliminate noise, and offer a clear path to resolution before the end-user ever notices a degradation in service. This proactive approach is the cornerstone of technical resilience.
The transition from manual monitoring to intelligent alerting involves more than just setting up notifications. It requires a cultural change where developers and operations teams share responsibility for the health of the system. Alerting tools in the modern era leverage artificial intelligence to distinguish between harmless background noise and genuine threats. By adopting these ten essential tools, you can transform your incident response from a chaotic fire drill into a disciplined, automated, and predictable process. This guide explores the best instruments for early detection, ensuring your cluster states remain stable and your delivery pipeline stays operational at all times.
PagerDuty: The Gold Standard for Incident Response
PagerDuty has solidified its position as the industry leader for incident management by offering a sophisticated platform that unifies alerting, on-call scheduling, and automated response. It acts as a central hub, collecting signals from hundreds of different monitoring tools and translating them into actionable incidents. Its primary strength lies in its advanced event intelligence, which uses machine learning to group related alerts and suppress redundant notifications. This ensures that when an engineer is paged, it is for a unique and high-priority issue that truly requires human intervention.
The platform also offers robust features for managing the human side of DevOps, such as flexible on-call rotations and escalation policies. In a global technical environment, PagerDuty ensures that the right person is notified at the right time, regardless of their time zone. By utilizing ChatOps techniques, teams can acknowledge and resolve incidents directly from their Slack or Microsoft Teams channels. This seamless integration between technical signals and human collaboration makes PagerDuty a vital component of any enterprise-grade reliability strategy designed for the demanding digital economy.
Opsgenie: Cost-Effective Alert Management
For teams looking for a powerful yet cost-effective alternative, Opsgenie (now part of Atlassian) offers an exceptional feature-to-price ratio. It provides many of the same core capabilities as PagerDuty, including on-call management, alert routing, and sophisticated escalation rules. One of its standout features is the deep integration with the Jira ecosystem, allowing for automated ticket creation and status synchronization. This ensures that every alert is tracked and documented, providing a clear audit trail for post-mortem analysis and continuous improvement.
Opsgenie excels at handling "alert storms" by providing granular filtering and noise reduction rules. Engineers can customize exactly how and when they want to be notified, reducing the risk of burnout. The tool also includes a "heartbeat" monitoring feature that ensures your external monitoring tools are still connected and sending data. This "monitoring the monitor" approach is a key part of proactive operations. By adopting Opsgenie, growing teams can achieve a high level of technical maturity and system visibility without the premium cost of enterprise-only platforms, making it a favorite for startups and mid-sized organizations.
Datadog: Unified Monitoring and Intelligent Alerting
Datadog is a comprehensive observability platform that unifies infrastructure monitoring, application performance, and security into a single pane of glass. Its alerting capabilities are built directly on top of this massive data set, allowing for highly contextual notifications. With its Watchdog AI feature, Datadog can automatically detect anomalies in your metrics without requiring you to set manual thresholds. This is particularly useful for detecting subtle performance regressions or "slow-burn" issues that might evade traditional monitoring rules in a busy production environment.
The platform supports a wide variety of alert types, including threshold-based, outlier, and forecast alerts. This flexibility allows teams to monitor everything from simple CPU spikes to complex business KPIs like payment success rates. By utilizing continuous verification, Datadog ensures that your cluster states are always being measured against their intended healthy baselines. It provides a data-driven foundation for your entire engineering team, allowing for faster root cause analysis and a more resilient path from code commit to successful user delivery.
Comparison of Top DevOps Alerting Tools
| Tool Name | Primary Focus | Key Automation Feature | Best For |
|---|---|---|---|
| PagerDuty | Incident Management | AI Event Intelligence | Large Enterprises |
| Opsgenie | Alert Handling | Jira / Atlassian Sync | Agile Teams |
| Datadog | Full-Stack Observability | Watchdog Anomaly Detection | Cloud-Native Apps |
| Prometheus | Metrics & Alerting | Alertmanager Routing | Kubernetes Clusters |
| Splunk On-Call | SRE Collaboration | Live Call Routing | Complex Data Teams |
Prometheus Alertmanager for Kubernetes Native Alerting
Prometheus has become the default monitoring standard for Kubernetes, and its Alertmanager component provides a robust and flexible way to handle notifications in a containerized world. Alertmanager handles alerts sent by the Prometheus server, taking care of deduplicating, grouping, and routing them to the correct receiver, such as email, PagerDuty, or Slack. This declarative alerting model ensures that your monitoring rules are as version-controlled and predictable as your application manifests. It is an essential tool for any team managing large-scale cluster states.
One of the greatest strengths of Alertmanager is its support for "silences," which allows you to temporarily mute alerts for specific services during planned maintenance. This prevents unnecessary pages and helps maintain the team's focus on actual production issues. By utilizing GitOps to manage your alerting rules, you ensure that every change is auditable and can be reviewed by the entire team. Prometheus and Alertmanager provide the high-quality telemetry needed to drive automated remediation and self-healing infrastructure, making it a cornerstone of modern cloud-native engineering.
Splunk On-Call: Streamlining SRE Collaboration
Formerly known as VictorOps, Splunk On-Call is designed specifically with the Site Reliability Engineer in mind. It emphasizes collaboration and real-time communication during a crisis. Its unique "timeline" view provides a centralized feed of all alerts, chats, and automated system events, allowing the entire team to see the sequence of a failure as it unfolds. This visibility is invaluable for root cause analysis and helps prevent multiple engineers from working on the same problem in isolation. It turns incident response into a transparent and highly coordinated team sport.
The platform also features a powerful "Transmogrifier" (alert rules engine) that can enrich incoming alerts with links to runbooks, charts, and troubleshooting documentation. This ensures that when an engineer receives an alert, they have all the context they need to begin the incident handling process immediately. By integrating with the broader Splunk ecosystem, it provides a deep connection between historical logs and real-time events. This synergy is a major driver of technical agility, allowing organizations to maintain high uptime and rapidly resolve even the most complex distributed system failures across global cloud regions.
Best Practices for Early Issue Detection
- Set Clear Thresholds: Define your alerting boundaries based on historical data and Service Level Objectives (SLOs) to minimize false positives and negatives.
- Reduce Alert Fatigue: Use AI-powered grouping and suppression to ensure that only unique and actionable incidents result in a notification.
- Automate Incident Runbooks: Attach digital runbooks directly to your alerts to provide engineers with immediate remediation steps and context.
- Monitor Dependencies: Don't just watch your own services; implement blackbox monitoring to track the health of third-party APIs and cloud provider status.
- Enforce Security Policies: Use admission controllers to ensure that every new service is deployed with the necessary monitoring and alerting labels.
- Implement Continuous Feedback: Regularly review your alert noise and adjust your rules based on real-world incident outcomes and post-mortem findings.
- Scan for Secrets: Use secret scanning tools to ensure no credentials are accidentally included in the metadata sent to your alerting platforms.
Following these best practices will transform your alerting from a source of stress into a powerful engine for predictability and growth. As you move toward AI augmented devops, you can explore even more sophisticated patterns like predictive alerting, where the system warns you before a failure even happens. The ultimate goal of a high-quality alerting tool is to make the infrastructure invisible to the business, allowing your developers to focus on innovation. By prioritizing early detection today, you are building a resilient technical foundation that will protect your brand and your users through any challenge the digital world throws your way.
Conclusion: Building a Resilient Monitoring Strategy
In conclusion, the ten DevOps alerting tools discussed in this guide represent the best of modern technical innovation. From the AI-driven precision of PagerDuty to the Kubernetes-native power of Prometheus and the collaborative focus of Splunk On-Call, these instruments provide the sensory awareness needed to survive in the fast-paced cloud era. By moving beyond reactive firefighting and embracing proactive early detection, you can achieve a level of system stability that drives measurable business value. The choice of tool depends on your team's size, budget, and existing technical stack, but the goal remains the same: total visibility and rapid response.
As you move forward, consider who drives cultural change within your engineering organization. Adopting these advanced tools is as much a mindset shift as it is a technical implementation. By staying informed about release strategies and the latest observability trends, you can ensure that your system remains resilient as it scales. Ultimately, a world-class alerting strategy is one that empowers your team, protects your users, and ensures that your software delivery remains a source of strength for your business. Start with one high-impact tool today and build your way toward a truly observable and self-healing future.
Frequently Asked Questions
What is the primary role of an alerting tool in DevOps?
Alerting tools monitor system health and performance, notifying the right team members the moment an issue or anomaly is detected in the environment.
How does AI reduce alert fatigue for engineers?
AI groups related alerts into single incidents and suppresses low-priority noise, ensuring engineers only respond to critical and unique technical failures.
What is the difference between PagerDuty and Opsgenie?
PagerDuty is an enterprise-grade platform with advanced AI automation, while Opsgenie is a cost-effective alternative with tight integration into the Atlassian suite.
Why is Prometheus Alertmanager important for Kubernetes?
It provides a native way to route and manage alerts for containerized workloads, ensuring that monitoring stays in sync with your versioned cluster state.
What is an actionable alert in a DevOps context?
An actionable alert provides the specific error, relevant logs, and a link to a runbook, allowing the responder to take immediate fix steps.
How can I monitor the health of my third-party APIs?
Use blackbox monitoring and synthetic probes to regularly test the connectivity and response times of any external services your application depends on.
What is a "heartbeat" monitor in alerting tools?
A heartbeat monitor ensures that your primary monitoring tool is still active; if it stops sending signals, the alerting platform triggers a notification.
Can I ack and resolve alerts from Slack?
Yes, most modern alerting tools offer deep ChatOps integrations that allow you to manage the entire incident lifecycle without leaving your chat application.
What is an escalation policy in on-call management?
It is a defined rule that notifies a secondary or manager-level engineer if the primary on-call person does not acknowledge an alert within a set time.
How do I prevent "alert storms" from overwhelming my team?
Use event intelligence and alert correlation tools to group hundreds of related signals into a single incident that is much easier to manage.
What is the benefit of a digital runbook?
A digital runbook provides standardized, step-by-step procedures for resolving common incidents, reducing human error and accelerating recovery times during a high-stakes crisis.
How often should I review my alerting thresholds?
Thresholds should be reviewed at least once a quarter or after any major architectural change to ensure they remain aligned with your current performance.
What is a post-mortem and why is alerting part of it?
A post-mortem analyzes an incident's cause; reviewing the alert's timing and accuracy is essential for improving future detection and response strategies and speed.
Can small teams use enterprise alerting tools?
Yes, many tools like PagerDuty and Datadog offer free or starter tiers specifically designed for smaller teams and startups to get started with.
What is the first step in setting up a DevOps alerting system?
The first step is to identify your most critical system metrics and establish a baseline for what "healthy" behavior looks like for your application.
What's Your Reaction?
 Like
0
 Dislike
0
 Love
0
 Funny
0
 Angry
0
 Sad
0
Sad
0
 Wow
0
Wow
0


![Kong Interview Preparation Guide [2025]](https://www.devopstraininginstitute.com/blog/uploads/images/202509/image_430x256_68dbb95326997.jpg)


![100+ Azure DevOps Interview Questions and Answers [Updated 2025]](https://www.devopstraininginstitute.com/blog/uploads/images/202509/image_140x98_68c40aa9a3834.jpg)


![90+ Git and GitHub Interview Questions [2025]](https://www.devopstraininginstitute.com/blog/uploads/images/202509/image_140x98_68c40a7931d60.jpg)


![Future Scope of DevOps Careers in Pune [Updated 2025]](https://www.devopstraininginstitute.com/blog/uploads/images/202510/image_140x98_68e3a84652312.jpg)


