


![Kong Interview Preparation Guide [2025]](https://www.devopstraininginstitute.com/blog/uploads/images/202509/image_430x256_68dbb95326997.jpg)


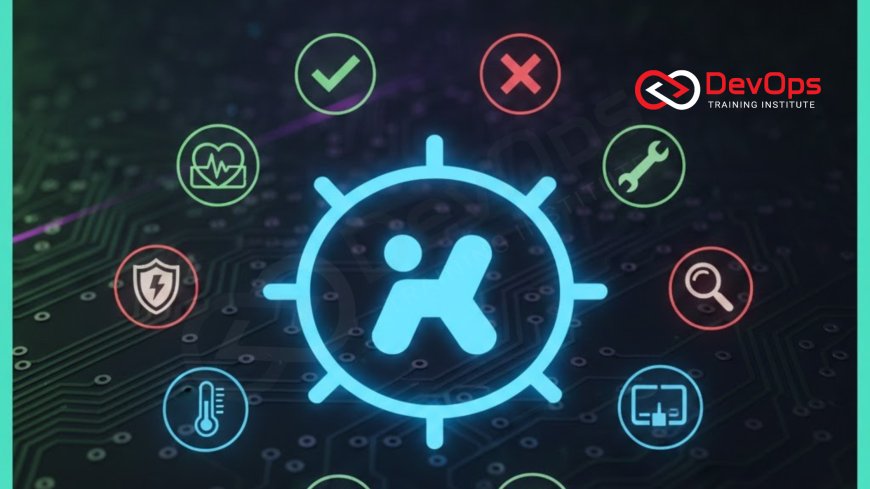
10 Kubernetes Health Checks Every DevOps Must Use
Master the 10 most crucial Kubernetes health checks, including Liveness, Readiness, and Startup probes, that every DevOps engineer must implement for highly reliable and resilient containerized applications. This guide explains how to leverage these probes to ensure zero-downtime deployments, rapid service recovery, and intelligent traffic routing. Learn advanced techniques for integrating application logic into readiness checks, securing your probes, and monitoring the stability of your Pods to maintain high availability and efficient resource utilization in dynamic, cloud-native environments, proving that proactive health management is key to operational excellence.
Introduction
Kubernetes provides the capability to scale and orchestrate microservices, but its true power lies in its ability to manage failure. The primary mechanism by which Kubernetes monitors the well-being of its workloads and achieves self-healing is through health checks, known as probes. Without correctly configured probes, Kubernetes cannot intelligently determine if a Pod is actually ready to serve traffic or if a critical process has died. This results in traffic being routed to unhealthy application instances or prolonged downtime while the orchestrator attempts to figure out why a service is failing.
For any DevOps team, mastering Kubernetes probes is non-negotiable. They are the contract between your application and the orchestrator, dictating when a Pod should be restarted, when it should be taken out of a service's load balancing rotation, and when it is finally ready for the world. Incorrectly configured probes are a common source of deployment failures, service instability, and unnecessary container restarts. A robust health check strategy contributes directly to maintaining high availability and achieving zero-downtime deployments, which is essential for a high-velocity environment.
This guide breaks down the 10 most crucial Kubernetes health check techniques every DevOps engineer must implement. We'll cover the three main types of probes and how to implement them effectively using different methods (HTTP, TCP, Exec). Furthermore, we will delve into advanced settings and practices that move beyond basic checks, enabling intelligent traffic management and enhancing the overall resilience of your cloud-native applications. Adopting these practices is the foundation of operational maturity in Kubernetes.
Pillar I: The Three Foundational Probe Types
Kubernetes utilizes three distinct types of probes, each serving a different purpose in the lifecycle and operation of a Pod. Misunderstanding their roles and configurations is the root cause of most probe-related issues. They are the core mechanism for the kubelet to communicate with the application, ensuring accurate status reporting to the control plane.
1. Liveness Probes (Self-Healing)
The Liveness Probe is Kubernetes' way of determining if your application is running in an unhealthy state and needs to be restarted. If this probe fails, the kubelet (the agent on the node) kills the container, and the Pod's restart policy takes over (usually restarting the container). Liveness probes should only check for fatal conditions, such as a dead process, a database connection pool deadlock, or an unrecoverable memory leak. If the application is alive but temporarily overloaded, the Liveness Probe should not fail, as this would cause a destructive restart.
livenessProbe:
  httpGet:
    path: /healthz/live
    port: 8080
  initialDelaySeconds: 15 # Wait 15s after startup before first check
  periodSeconds: 20
  failureThreshold: 3
2. Readiness Probes (Traffic Management)
The Readiness Probe determines if a Pod is ready to serve traffic and should be included in the Service's load balancing rotation. If the probe fails, the Pod's IP is automatically removed from the associated Service's Endpoints object, immediately stopping traffic flow to that Pod without killing the container. This probe is ideal for handling temporary situations like initialization delays, cold starts, or database connection outages. When the probe succeeds, the Pod is re-added to the Service, making it a critical tool for achieving zero-downtime deployments, ensuring no traffic is routed to a service that is still initializing.
readinessProbe:
  httpGet:
    path: /healthz/ready
    port: 8080
  periodSeconds: 5
  failureThreshold: 2
3. Startup Probes (Handling Slow Initialization)
The Startup Probe handles applications that take a long time to start (e.g., legacy Java applications, large data loading). When defined, it temporarily disables Liveness and Readiness probes until it succeeds. If the Startup Probe fails too many times, the Pod is restarted. This prevents the Liveness Probe from prematurely restarting a slow-starting but healthy container. Once the Startup Probe succeeds once, it is disabled, and the Liveness and Readiness probes take over the continuous monitoring of the Pod, simplifying the management of complex and slow application initialization processes.
startupProbe:
  httpGet:
    path: /healthz/startup
    port: 8080
  periodSeconds: 10
  failureThreshold: 12 # Allows up to 120 seconds (10s * 12) for startup
Pillar II: Probe Implementation Methods
Probes can be implemented using three primary methods, each suitable for different types of applications and dependencies. Choosing the correct method ensures the check is accurate and low-overhead, which is essential for efficient resource utilization and reliable operational performance.
4. HTTP Probes (Standard Web/API Check)
This is the most common method, ideal for web applications and APIs. Kubernetes sends an HTTP GET request to a specified path and port. A success code (200-399) indicates health, and any other response (4xx, 5xx, or connection refusal) indicates failure. For complex checks, the application code behind the health endpoint should check external dependencies (e.g., database connection status, downstream service health) and return a 200 only if all critical paths are operational.
5. TCP Socket Probes (Basic Port Check)
The TCP Probe is a simpler, non-application-specific check. It attempts to open a TCP socket on the specified port. If the connection is successfully established, the Pod is considered healthy/ready. This is suitable for non-HTTP services like databases, message queues, or custom TCP servers where a basic port listening check is sufficient to confirm the process is running and accepting connections. It offers a low-overhead, reliable status signal for fundamental process availability.
6. Exec Probes (Custom Script Check)
The Exec Probe executes a command inside the container. The Pod is considered healthy/ready if the command returns an exit status code of 0. Any non-zero exit code signals failure. This is often used for deep, custom logic checks (e.g., checking log files, verifying configuration state, or running a specific diagnostic script). The command executed must be lightweight and fast, as slow exec probes can consume significant resources on the Node's kubelet, slowing down the entire process and introducing unnecessary overhead to the system.
Pillar III: Advanced Resilience and Security
Moving beyond basic probe types, advanced practices focus on making the health check process itself more resilient, secure, and integrated with the application's performance and dependencies. These practices are crucial for maintaining stability in highly dynamic and secure environments.
7. Differentiating Live vs. Ready Endpoints
Crucially, the Liveness and Readiness checks should use separate endpoints. The Liveness endpoint (/healthz/live) should be simple, maybe just returning success if the web server can respond. The Readiness endpoint (/healthz/ready) should check critical external dependencies (databases, API Gateways, message queues). Failing Liveness causes a destructive restart; failing Readiness causes a graceful withdrawal from traffic, ensuring that the appropriate action is taken for each failure type, maximizing the system's ability to recover from both fatal and transient failures quickly.
8. Configurable initialDelaySeconds and failureThreshold
Use the initialDelaySeconds setting to provide a buffer for the application to start before the first probe is executed. Use the failureThreshold and periodSeconds to define the total time window allowed for a probe to fail before action is taken. These settings prevent premature restarts of slow applications and tune the self-healing process to match the application's actual startup and recovery characteristics, preventing instability that arises from aggressive, untuned probe settings. Tuning these thresholds is a critical operational task.
9. Application-Level Dependency Checks (Ready State)
The most sophisticated Readiness Probes integrate application logic to check the state of external dependencies. For example, the readiness endpoint could ping the database, check a specific configuration file, or verify connectivity to a critical downstream service. If any required external resource is unavailable, the readiness check fails, and the Pod is temporarily removed from service until the dependency recovers. This ensures that only fully operational instances receive traffic, which is vital for preventing cascading failures in a microservices architecture. This is far more effective than just checking the application process status.
10. Securing Health Check Endpoints
Health check endpoints should be designed with security in mind. They should not expose any sensitive data. While the kubelet (the probe executor) has access to the Node, the health check itself is an attack vector. Best practices include using dedicated, non-default ports, limiting the information returned by the probe (a simple HTTP 200 is sufficient), and ensuring that the host OS (e.g., RHEL) is hardened against potential compromise of the kubelet agent, which is essential for DevSecOps. The security of the underlying host OS is paramount for the integrity of the cluster itself, as the kubelet has high privileges.
11. Monitoring Probe Statuses (Observability)
The health check status is itself a crucial operational metric. DevOps teams must monitor the aggregate success and failure rates of all Liveness and Readiness probes using tools like Prometheus. A sudden increase in failed probes is often the earliest signal of a systemic issue, triggering alerts faster than business-level metrics. Correlating failed probes with recent deployments or log management entries allows for quicker root cause analysis, proving that proactive observability is essential for effective incident response.
12. Implementing Graceful Termination with Readiness
When a Pod is shutting down (e.g., during a scaling event or rolling update), the Readiness Probe should immediately begin failing. This instantly removes the Pod's IP from the Service Endpoints, stopping new traffic from being routed to it. By combining a failing Readiness Probe with a sufficiently long terminationGracePeriodSeconds, you ensure a graceful degradation where the Pod can complete its in-flight requests before the process is finally terminated. This mechanism is key to achieving zero-downtime deployments, providing a smooth transition of traffic away from the terminating container.
Conclusion
The reliability of any Kubernetes application is directly proportional to the intelligence and rigor of its health check strategy. The 12 techniques detailed—encompassing the critical roles of Liveness, Readiness, and Startup probes, along with advanced practices for dependency checking and graceful termination—are the foundational elements of resilient cloud-native operations. Mastering these probes is essential for any DevOps professional, as they govern the core processes of self-healing and traffic management within the orchestrator.
Your strategy must differentiate clearly between fatal errors (Liveness), temporary unavailability (Readiness), and slow startup (Startup). By pairing these probes with secure implementation methods and monitoring their status, you gain complete control over how your application responds to failure. Furthermore, integrating the checks with application logic and ensuring the security of the underlying infrastructure, such as adhering to RHEL 10 post-installation checklist best practices, provides a comprehensive, defense-in-depth approach to operational resilience, minimizing downtime and maximizing availability.
Probes are the contract for operational trust. Implement them meticulously, test them continuously, and monitor their results diligently. This commitment to proactive health management not only ensures stable deployments but also significantly improves the overall efficiency and reliability of your microservices architecture, guaranteeing that your container orchestration environment functions at peak performance and security, ensuring that you can deploy new versions quickly and with high confidence, which is vital for maintaining a competitive edge in modern software delivery.
Frequently Asked Questions
What is the difference between a Liveness Probe and a Readiness Probe?
A Liveness Probe fails if the application process is fatally broken and triggers a restart. A Readiness Probe fails if the application is temporarily unable to serve traffic and triggers removal from the service load balancing rotation.
When should I use a Startup Probe?
Use a Startup Probe for applications that have a long initialization time, preventing the Liveness Probe from timing out and prematurely restarting a slow but healthy container during its initial boot sequence.
What is the purpose of the failureThreshold setting?
The failureThreshold defines the number of consecutive probe failures allowed before Kubernetes takes the specified action (restart for Liveness, removal from service for Readiness).
Why is it bad practice to fail the Liveness Probe during a database outage?
Failing Liveness during a transient database outage causes unnecessary restarts, which prolongs recovery. The Readiness Probe should fail instead, routing traffic away until the database is available again.
How do HTTP Probes contribute to application resilience?
HTTP Probes allow the application code to perform deep, internal checks (including dependencies) and report back the status, enabling intelligent self-healing and traffic control based on actual application logic, not just process status.
How does the Readiness Probe help achieve zero-downtime deployments?
It ensures that old Pods remain in the Service until new Pods are fully started and passing all checks, and it immediately removes terminating Pods from the rotation, guaranteeing no traffic is ever sent to an unhealthy or shutting-down instance.
Why should the Liveness and Readiness Probes use separate endpoints?
They have different responsibilities (fatal check vs. traffic check). Using separate endpoints allows the application to report different statuses based on the severity of the failure, ensuring the orchestrator takes the correct, appropriate action.
What is the role of API Gateways in relation to Readiness Probes?
API Gateways rely on the Service's Endpoints (which are governed by the Readiness Probes) to know which microservices are available, ensuring the gateway doesn't route client requests to unavailable backends.
How can I use an Exec Probe for advanced health checking?
An Exec Probe can run a custom diagnostic script inside the container (e.g., checking log size, querying an internal cache) and returns a status code of 0 for success, allowing complex, custom logic checks that go beyond simple network connectivity.
How does RHEL 10 log management relate to failed probes?
Failed probes should trigger corresponding error logs. Centralized log management allows engineers to quickly correlate the time of the probe failure with the detailed error messages in the application logs, accelerating root cause analysis and diagnosis.
Why is monitoring probe status essential for observability?
The aggregate probe success/failure rate is a direct, real-time measure of service stability, providing a leading indicator of systemic issues faster than business metrics, and it's essential for triggering early alerts and monitoring the health of the release cadence.
How does firewall management secure health check endpoints?
While the kubelet must access the probe port, strict host-level firewall rules ensure that only the kubelet agent and necessary internal services can access the health check endpoints, mitigating the probe as a potential external attack vector.
How does the terminationGracePeriodSeconds work with Readiness Probes?
During shutdown, the Readiness Probe fails immediately, removing the Pod from the Service. The terminationGracePeriodSeconds then allows the Pod time to finish in-flight requests before it is forcefully terminated, ensuring a graceful traffic transition.
What is the best practice for securing the underlying host OS related to probes?
Adhering to security best practices like the RHEL 10 hardening best practices ensures that the kubelet agent, which executes the probes, and the Node itself are protected against compromise, maintaining the integrity of the cluster's self-healing mechanisms.
Why is the TCP Probe often used for database containers?
The TCP Probe is simple and low-overhead. For database containers, successfully establishing a TCP connection to the database port is often a sufficient basic check to confirm that the database process is running and accepting network connections.
What's Your Reaction?
 Like
0
Like
0
 Dislike
0
Dislike
0
 Love
0
Love
0
 Funny
0
Funny
0
 Angry
0
Angry
0
 Sad
0
Sad
0
 Wow
0
Wow
0


![100+ Azure DevOps Interview Questions and Answers [Updated 2025]](https://www.devopstraininginstitute.com/blog/uploads/images/202509/image_140x98_68c40aa9a3834.jpg)


![Future Scope of DevOps Careers in Pune [Updated 2025]](https://www.devopstraininginstitute.com/blog/uploads/images/202510/image_140x98_68e3a84652312.jpg)


