


![Kong Interview Preparation Guide [2025]](https://www.devopstraininginstitute.com/blog/uploads/images/202509/image_430x256_68dbb95326997.jpg)


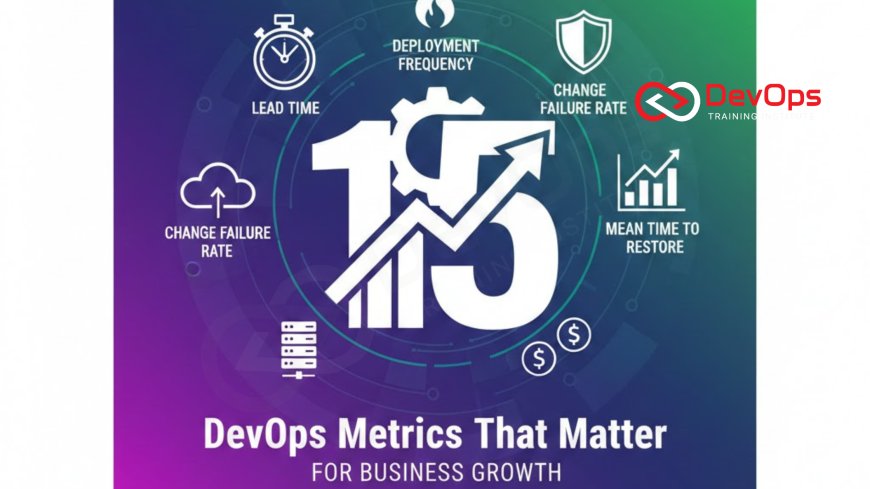
15 DevOps Metrics That Matter for Business Growth
Discover the 15 most important DevOps metrics in 2025 that directly impact revenue, customer satisfaction, and innovation speed. Includes DORA metrics, business-aligned KPIs, practical benchmarks, and tools to track them effectively.
Introduction
Great engineering teams don’t just ship code faster; they ship value faster. In 2025, the most successful organizations measure DevOps success not by lines of code or number of containers, but by business outcomes: revenue growth, customer happiness, and market speed. This guide covers the 15 critical DevOps metrics that actually move the needle for executives and stakeholders. From the classic DORA four keys to modern business-aligned indicators, tracking these will help you prove DevOps ROI and secure budget. Many teams store pipeline artifacts and logs in Amazon S3 to enable long-term metric analysis and auditing.
1. Deployment Frequency
- How often you deploy to production (per day/week/month)
- Elite performers: multiple deploys per day
- High performers: 1–6 per week
- Directly correlates with market competitiveness
- Track via CI/CD tools (GitHub Actions, Jenkins, GitLab)
- Goal for most teams: at least once per week
- Drives faster feedback and feature delivery
2. Lead Time for Changes
The time from code commit to code running in production. Elite teams achieve under one hour, while low performers take months. Reducing lead time allows rapid response to customer needs and market changes.
Short lead times are the #1 predictor of continuous delivery maturity and overall business agility.
3. Change Failure Rate (CFR)
- Percentage of deployments causing a failure in production
- Elite: 0–15%
- High: 16–30%
- Many teams use S3 event notifications to trigger instant rollback alerts
- Lower CFR = safer, more confident releases
- Track incidents caused by recent deploys
- Target: under 15% for sustainable growth
4. Mean Time to Recovery (MTTR)
How long it takes to recover from a production incident. Elite teams recover in under one hour. This metric measures resilience and directly impacts customer trust and revenue during outages.
Netflix made MTTR famous with chaos engineering; most companies now aim for under 4 hours.
5. Cycle Time
- Time from first commit to production deployment
- Includes code review, testing, and approval time
- Elite performers: under 1 day
- Measures end-to-end flow efficiency
- Automated data migration to S3 often reduces cycle time bottlenecks
- Track with tools like LinearB, Flow, or GitLab
- Directly affects feature velocity
6. Flow Efficiency
Percentage of time work items spend actively being worked on vs. waiting. Most teams operate at 15–25% flow efficiency. World-class teams reach 40%+ by removing bottlenecks and wait states.
Improving flow efficiency is often the fastest way to double throughput without adding headcount.
7. Cost per Deployment
- Total cost (people + tools + cloud) divided by number of deployments
- Elite teams: under $100 per deployment
- Tracks automation ROI over time
- Monitoring S3 usage with CloudWatch helps control storage costs
- Should trend downward as automation increases
- Critical for justifying DevOps investment
8. Customer Ticket Volume
Number of support tickets per deploy or per sprint. Elite teams see dramatic reductions as quality improves. This is one of the few DevOps metrics customer support teams care about.
A 50% drop in tickets often pays for the entire DevOps transformation.
9. Revenue per Deployment
- Business value generated divided by number of deployments
- Tracks whether frequent deploys actually create revenue
- Use S3 cost optimization to maximize profit per deploy
- Elite teams see steady increase over time
- Aligns engineering directly with business goals
- Most powerful metric for executive buy-in
10. Developer Productivity (SPACE Framework)
Modern framework measuring Satisfaction, Performance, Activity, Communication, Efficiency. Replaces outdated metrics like lines of code or velocity points.
High developer satisfaction directly predicts lower turnover and higher output quality.
11. Escaped Defects Rate
- Defects found by customers vs. found internally
- Goal: under 5% escape rate
- Measures testing effectiveness
- Directly impacts brand reputation
- Track via customer feedback and support data
12. Infrastructure Cost per Customer
Cloud spend divided by active users or revenue. Elite teams maintain steady or declining trend despite growth, thanks to optimization and auto-scaling.
Critical for SaaS businesses proving unit economics.
13. Feature Usage Rate
- Percentage of released features actually used by customers
- Average company: 20–30%
- Best teams: 60%+
- Measures value delivery accuracy
- Drives product strategy
14. Employee Retention Rate (Engineering)
High-performing DevOps teams retain 90%+ of engineers annually. Poor practices lead to burnout and high turnover costing millions.
Best single indicator of sustainable pace and healthy culture.
15. Time to Value (T2V)
- Time from idea approval to customer value realization
- Combines lead time, cycle time, and adoption lag
- Elite teams: under 2 weeks
- Ultimate business metric for DevOps
- Directly impacts revenue recognition
Key DevOps Metrics Dashboard (2025 Benchmarks)
| Metric | Elite | High | Medium/Low |
|---|---|---|---|
| Deployment Frequency | Multiple/day | Weekly | Monthly |
| Lead Time for Changes | < 1 hour | < 1 week | > 1 month |
| Change Failure Rate | 0–15% | 16–30% | > 30% |
| MTTR | < 1 hour | < 1 day | > 1 day |
| Cost per Deployment | < $100 | $100–500 | > $500 |
Conclusion
The era of measuring DevOps by activity alone is over. In 2025, elite organizations track these 15 metrics to prove engineering is a profit center, not a cost center. Start with the four DORA metrics (deployment frequency, lead time, change failure rate, MTTR), add business-aligned ones like revenue per deployment and customer tickets, and continuously improve. The teams that measure what matters don’t just survive; they dominate their markets.
Frequently Asked Questions
Which four metrics should every team track first?
The DORA four keys: Deployment Frequency, Lead Time for Changes, Change Failure Rate, and MTTR.
How do I calculate revenue per deployment?
Track feature flags or releases and attribute revenue uplift using A/B testing or cohort analysis.
Is lower cost per deployment always better?
Yes, as long as quality remains high. It shows increasing automation maturity.
Should startups care about these metrics?
Absolutely. Early measurement prevents painful scaling problems later.
What tools help track these metrics?
LinearB, Jellyfish, GitLab Value Stream Analytics, FourKeys (open source), and Flow.
What's Your Reaction?
 Like
0
Like
0
 Dislike
0
Dislike
0
 Love
0
Love
0
 Funny
0
Funny
0
 Angry
0
Angry
0
 Sad
0
Sad
0
 Wow
0
Wow
0


![100+ Azure DevOps Interview Questions and Answers [Updated 2025]](https://www.devopstraininginstitute.com/blog/uploads/images/202509/image_140x98_68c40aa9a3834.jpg)


![Future Scope of DevOps Careers in Pune [Updated 2025]](https://www.devopstraininginstitute.com/blog/uploads/images/202510/image_140x98_68e3a84652312.jpg)


