Which Tools Best Facilitate Multi-Cloud Monitoring for DevOps Teams?
Multi-cloud monitoring is a necessity for modern DevOps teams. This blog post explores the challenges of managing a distributed ecosystem and highlights how specialized tools provide a single, unified view. We detail key features to look for, from centralized visibility to data correlation, and compare leading solutions like Datadog, Dynatrace, and the open-source combination of Prometheus and Grafana, which is a major part of a successful business that is looking to scale its operations.
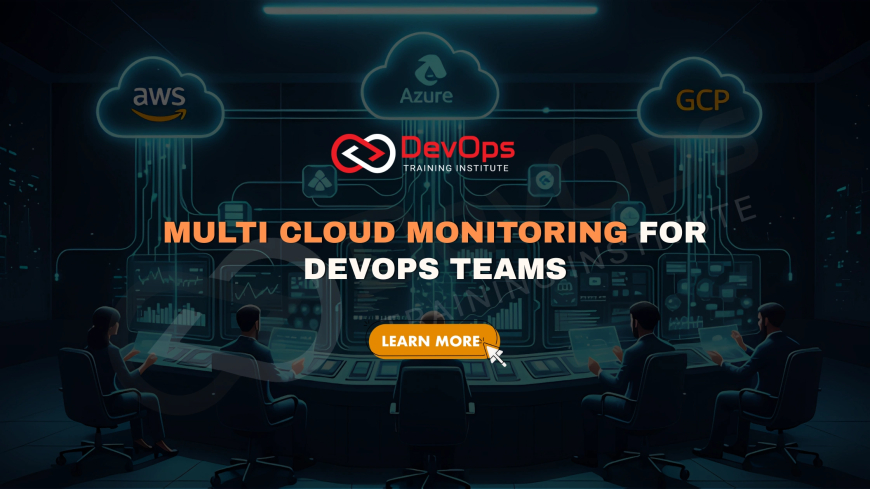
As organizations move beyond single-provider strategies, the complexity of managing applications and infrastructure across multiple cloud environments has grown exponentially. The appeal of a multi-cloud approach is clear: it offers greater flexibility, prevents vendor lock-in, and allows teams to leverage best-of-breed services from different providers. However, this strategy introduces a significant challenge for DevOps teams: maintaining a single, unified view of a distributed and diverse ecosystem. How can a team monitor application performance, security, and cost when infrastructure spans AWS, Azure, GCP, and a variety of other services? The answer lies in specialized multi-cloud monitoring tools and platforms designed to cut through the complexity. These solutions go beyond simple uptime checks by aggregating and correlating a massive volume of data—including metrics, logs, and traces—into a single pane of glass. This allows DevOps teams to move from reactive firefighting to proactive, data-driven optimization. This blog post will explore the core challenges of multi-cloud monitoring and highlight the key features and leading tools that enable DevOps teams to master their multi-cloud environments.
Table of Contents
- The Challenges of Multi-Cloud Monitoring
- The Three Pillars of Observability
- What Features to Look for in a Multi-Cloud Tool
- Leading Multi-Cloud Monitoring Solutions
- A Comparison of Leading Tools
- Implementing a Multi-Cloud Monitoring Strategy
- Conclusion
- Frequently Asked Questions
The Challenges of Multi-Cloud Monitoring
Multi-cloud environments present a unique set of challenges that can overwhelm traditional monitoring approaches. The most significant issue is data silos. Each cloud provider—AWS, Azure, and Google Cloud—has its own set of native monitoring tools (e.g., CloudWatch, Azure Monitor, and Cloud Operations) with different data formats, APIs, and dashboards. This fragmentation makes it nearly impossible for a DevOps team to get a holistic view of the entire infrastructure. This lack of a unified view can lead to blind spots, making it difficult to detect and diagnose issues that span across multiple cloud platforms. For example, a performance issue in an application running on Azure might be caused by a database latency problem on AWS, but without a centralized tool to correlate the data, pinpointing the root cause becomes a time-consuming and manual process. This can significantly increase the mean time to resolution (MTTR) and impact the overall reliability of the application, which is a major part of the modern workflow that is focused on providing a high level of service to the business and its customers.
Complexity and Security Risks
Beyond data silos, multi-cloud environments introduce management complexity and heightened security risks. Managing different identity and access management (IAM) systems and security protocols across multiple clouds is a significant challenge. This fragmented security posture can lead to misconfigurations and vulnerabilities, which can be exploited by malicious actors. A unified monitoring tool provides a centralized view of security events and compliance violations, which is a major part of a successful business that is looking to scale its operations and is a major part of the modern workflow that is focused on providing a high level of service to the business and its customers.
The Three Pillars of Observability
To effectively monitor a multi-cloud environment, DevOps teams must move beyond traditional monitoring and embrace observability. Observability is the ability to understand a system's internal state by examining its external outputs. It is built on three main types of telemetry data: metrics, logs, and traces. A robust multi-cloud monitoring tool must be able to collect, normalize, and correlate these three data types from across all cloud providers. Metrics are numerical values collected over time, such as CPU utilization, memory usage, and network latency. They are perfect for high-level monitoring and alerting. Logs are time-stamped, immutable records of events that occur within an application or system. They are essential for detailed troubleshooting and debugging. Traces record the end-to-end journey of a user request as it travels through a distributed application, providing a complete picture of how services interact. By combining these three data types, a monitoring platform can provide a complete, end-to-end view of the entire infrastructure, regardless of where the components are hosted, which is a major part of the modern workflow that is focused on providing a high level of service to the business and its customers and is a major part of a successful business that is looking to scale its operations.
The Shift from Monitoring to Observability
The shift from monitoring to observability is crucial for multi-cloud success. Traditional monitoring answers "Is it up?" while observability answers "Why is it down?". This subtle but important shift in focus allows a team to quickly pinpoint the root cause of an issue, which is a major part of the modern workflow that is focused on providing a high level of service to the business and its customers.
What Features to Look for in a Multi-Cloud Tool
When selecting a tool to facilitate multi-cloud monitoring, DevOps teams should look for several key features. The first is centralized visibility, which provides a single, unified dashboard to view data from all cloud environments. This is a major part of a successful business that is looking to scale its operations. The second is native integrations, as the tool should be able to seamlessly connect to a wide variety of cloud services and third-party tools. The third is data correlation, which automatically stitches together metrics, logs, and traces to provide a complete picture of an event or issue. The fourth is automated alerting, which sends real-time notifications based on customizable thresholds and conditions. Finally, the tool must have robust security and compliance features to help enforce policies and provide a clear audit trail. By prioritizing these features, a team can choose a tool that not only provides a unified view of their multi-cloud environment but also helps them to proactively manage their infrastructure, which is a major part of the modern workflow that is focused on providing a high level of service to the business and its customers and is a major part of a successful business that is looking to scale its operations.
The Importance of a Unified View
A unified view is the single most important feature of a multi-cloud monitoring tool. It eliminates data silos and provides a single source of truth for all teams, which is a major part of the modern workflow that is focused on providing a high level of service to the business and its customers and is a major part of a successful business that is looking to scale its operations.
Leading Multi-Cloud Monitoring Solutions
The market for multi-cloud monitoring tools is extensive, with both all-in-one platforms and open-source solutions competing for market share. Datadog is a leading all-in-one observability platform with over 700 native integrations, making it a powerful choice for teams that need a single, unified view of their entire stack. It excels at combining metrics, logs, and traces, which is a major part of the modern workflow that is focused on providing a high level of service to the business and its customers. Dynatrace is another all-in-one platform known for its AI-powered insights, which automatically detects issues and identifies the root cause. This reduces the need for manual troubleshooting and allows a team to focus on innovation. For teams that prefer a more open-source approach, the combination of Prometheus and Grafana is a powerful option. Prometheus is a time-series database and alerting tool, while Grafana is a data visualization and dashboarding tool. Together, they can be configured to provide a comprehensive view of a multi-cloud environment, though it requires more manual configuration and maintenance. Finally, tools like New Relic and Sumo Logic also provide a powerful set of features for multi-cloud monitoring, with a strong focus on application performance monitoring (APM) and log management, respectively, which is a major part of a successful business that is looking to scale its operations and is a major part of the modern workflow that is focused on providing a high level of service to the business and its customers.
The Open-Source vs. All-in-One Debate
The choice between an open-source tool and an all-in-one platform depends on a team's budget and expertise. An all-in-one platform provides a streamlined experience but comes with a higher price tag. An open-source solution is free to use but requires more time and expertise to configure and maintain, which is a major part of the modern workflow that is focused on providing a high level of service to the business and its customers and is a major part of a successful business that is looking to scale its operations.
A Comparison of Leading Tools
The following table provides a high-level comparison of the leading multi-cloud monitoring solutions. It is designed to quickly illustrate the strengths of each platform, making the value proposition of a modern approach readily apparent. By evaluating these factors, an organization can easily determine if they have reached the point where a traditional approach is no longer a viable or safe option for their business and is a major part of the strategic conversation that is needed for any organization that is looking to scale its operations.
| Criteria | Datadog | Dynatrace | Grafana/Prometheus | New Relic |
|---|---|---|---|---|
| Primary Focus | Comprehensive Observability Platform | AI-powered AIOps and Observability | Metrics-based Monitoring and Visualization | Application Performance Monitoring (APM) |
| Key Strength | Broadest range of integrations and a unified UI | Automatic root cause analysis with AI | Cost-effective and highly customizable | Deep insights into application code and performance |
| Complexity | Easy to deploy with a low learning curve | Automatic deployment and simple setup | Requires manual configuration and maintenance | Streamlined for developers and SREs |
| Pricing Model | Consumption-based model (pay-per-host/GB) | All-in-one pricing based on host units | Free and open-source, with optional paid services | Usage-based, with a free tier for small teams |
Implementing a Multi-Cloud Monitoring Strategy
Implementing a successful multi-cloud monitoring strategy involves more than just selecting the right tool. It requires a fundamental shift in how a DevOps team thinks about monitoring and observability. The first step is to define a clear set of goals and a clear set of metrics to track. The second step is to choose a tool that provides a unified view of all cloud environments and to integrate it with the existing toolchain. The third step is to automate as much as possible, from data collection to alerting. The final step is to empower a team with a clear set of roles and responsibilities and to create a clear and consistent process for making a data-driven decision about whether to approve or to deny a pipeline stage. This is a major part of the modern workflow that is focused on providing a high level of service to the business and its customers and is a major part of a successful business that is looking to scale its operations.
The Role of Data-Driven Decisions
A data-driven decision is a critical part of a modern CI/CD workflow. It ensures that the decision to approve or to deny a pipeline stage is based on real-time metrics, not guesswork, which is a major part of the modern workflow that is focused on providing a high level of service to the business and its customers.
Conclusion
Multi-cloud monitoring is no longer a luxury but a necessity for modern DevOps teams. By moving from a fragmented, siloed approach to a unified, observability-based one, an organization can achieve a high level of speed, reliability, and security. The right tool can provide a single source of truth for all teams, which is a major part of the modern workflow that is focused on providing a high level of service to the business and its customers. It can also help to automate a wide variety of tasks, from data collection to alerting, which is a major part of a successful business that is looking to scale its operations. By understanding the core challenges of multi-cloud monitoring and the key features to look for in a tool, a team can choose a solution that not only provides a unified view of their multi-cloud environment but also helps them to proactively manage their infrastructure, which is a major part of the modern workflow that is focused on providing a high level of service to the business and its customers and is a major part of a successful business that is looking to scale its operations.
Frequently Asked Questions
What is multi-cloud monitoring?
Multi-cloud monitoring is the process of overseeing and managing applications, workloads, and resources that operate across multiple cloud service providers. It involves tracking performance, availability, security, and costs in real-time from different cloud environments, which is a major part of the modern workflow that is focused on providing a high level of service to the business and its customers.
Why is multi-cloud monitoring important for DevOps?
Multi-cloud monitoring is crucial for DevOps teams as it provides a single, unified view of a distributed and diverse ecosystem, eliminating data silos and reducing the mean time to resolution (MTTR). This allows a team to move from reactive firefighting to proactive, data-driven optimization, which is a major part of the modern workflow that is focused on providing a high level of service to the business and its customers.
What are the main challenges of multi-cloud monitoring?
The main challenges of multi-cloud monitoring include managing data silos, different APIs, and security protocols across multiple clouds. This fragmentation makes it difficult for a DevOps team to get a holistic view of the entire infrastructure, leading to blind spots and increased security risks, which is a major part of a successful business that is looking to scale its operations.
What are the key features of a good multi-cloud monitoring tool?
A good multi-cloud monitoring tool should provide centralized visibility, native integrations, data correlation, automated alerting, and robust security and compliance features. These features help a team to proactively manage their infrastructure, which is a major part of the modern workflow that is focused on providing a high level of service to the business and its customers and is a major part of a successful business that is looking to scale its operations.
How do logs, metrics, and traces fit into multi-cloud monitoring?
Logs, metrics, and traces are the three pillars of observability. A robust multi-cloud monitoring tool must be able to collect, normalize, and correlate these three data types from across all cloud providers. They provide a complete, end-to-end view of the entire infrastructure, regardless of where the components are hosted, which is a major part of a successful business that is looking to scale its operations.
What is the difference between a native tool and a third-party tool?
A native tool, such as AWS CloudWatch or Azure Monitor, is specific to a single cloud provider. A third-party tool, such as Datadog or Dynatrace, is designed to work across multiple cloud providers. This is a major part of the modern workflow that is focused on providing a high level of service to the business and its customers and is a major part of a successful business that is looking to scale its operations.
What is the role of AI in multi-cloud monitoring?
AI plays a crucial role in multi-cloud monitoring by automatically detecting issues and identifying the root cause. This reduces the need for manual troubleshooting and allows a team to focus on innovation. This is a major part of the modern workflow that is focused on providing a high level of service to the business and its customers and is a major part of a successful business that is looking to scale its operations.
How does multi-cloud monitoring help with cost optimization?
Multi-cloud monitoring helps with cost optimization by providing a single, unified view of resource usage across all cloud environments. This allows a team to identify idle resources and over-provisioned instances, which can be a major part of a successful business that is looking to scale its operations and is a major part of the modern workflow that is focused on providing a high level of service to the business and its customers.
How does multi-cloud monitoring help with security?
Multi-cloud monitoring provides a centralized view of security events and compliance violations. This helps to enforce policies, such as the separation of duties, and to provide a clear audit trail of who approved a change and when. This is a major part of the modern workflow and is a major part of a successful business that is looking to scale its operations.
What is a unified dashboard?
A unified dashboard is a single, unified view of all data from all cloud environments. It provides a single source of truth for all teams, which is a major part of the modern workflow that is focused on providing a high level of service to the business and its customers and is a major part of a successful business that is looking to scale its operations.
What is the difference between monitoring and observability?
Monitoring answers "Is it up?" while observability answers "Why is it down?". Observability is the ability to understand a system's internal state by examining its external outputs, which is a major part of the modern workflow that is focused on providing a high level of service to the business and its customers and is a major part of a successful business that is looking to scale its operations.
What is Prometheus and Grafana?
Prometheus and Grafana are two open-source tools that can be configured to provide a comprehensive view of a multi-cloud environment. Prometheus is a time-series database and alerting tool, while Grafana is a data visualization and dashboarding tool. This is a major part of the modern workflow that is focused on providing a high level of service to the business and its customers.
How do you handle a multi-cloud monitoring strategy with a small team?
A small team should choose an all-in-one platform that provides a streamlined experience, such as Datadog or Dynatrace. This will allow them to focus on innovation, not manual configuration and maintenance. This is a major part of the modern workflow that is focused on providing a high level of service to the business and its customers and is a major part of a successful business that is looking to scale its operations.
What is the role of a data-driven decision?
A data-driven decision is a critical part of a modern CI/CD workflow. It ensures that the decision to approve or to deny a pipeline stage is based on real-time metrics, not guesswork, which is a major part of the modern workflow that is focused on providing a high level of service to the business and its customers.
How do you start with a multi-cloud monitoring strategy?
A good way to start with a multi-cloud monitoring strategy is to choose a simple service and to define a clear set of goals and a clear set of metrics to track. This will allow a team to get a feel for the process and to build momentum, which is a major part of the modern workflow and is a major part of a successful business that is looking to scale its operations.
How does multi-cloud monitoring improve reliability?
Multi-cloud monitoring improves reliability by providing a single source of truth for all teams. This allows a team to quickly pinpoint the root cause of an issue, which reduces the mean time to resolution (MTTR) and improves the overall reliability of the application, which is a major part of the modern workflow that is focused on providing a high level of service to the business and its customers.
What is the role of a unified tool in multi-cloud monitoring?
A unified tool provides a single source of truth for all teams, which is a major part of the modern workflow that is focused on providing a high level of service to the business and its customers and is a major part of a successful business that is looking to scale its operations. It also helps to automate a wide variety of tasks, from data collection to alerting.
What is the difference between a log management tool and a multi-cloud monitoring tool?
A log management tool is optimized for storing and querying log data at scale. A multi-cloud monitoring tool is a comprehensive platform that combines logs, metrics, and traces to provide a complete view of the entire infrastructure. This is a major part of the modern workflow that is focused on providing a high level of service to the business and its customers.
What is data correlation?
Data correlation is the process of stitching together metrics, logs, and traces to provide a complete picture of an event or issue. This is a major part of the modern workflow that is focused on providing a high level of service to the business and its customers and is a major part of a successful business that is looking to scale its operations.
What is an alerting tool?
An alerting tool is a tool that sends real-time notifications based on customizable thresholds and conditions. It is a major part of the modern workflow that is focused on providing a high level of service to the business and its customers and is a major part of a successful business that is looking to scale its operations.
What's Your Reaction?
 Like
0
 Dislike
0
 Love
0
 Funny
0
 Angry
0
 Sad
0
Sad
0
 Wow
0
Wow
0


![Kong Interview Preparation Guide [2025]](https://www.devopstraininginstitute.com/blog/uploads/images/202509/image_430x256_68dbb95326997.jpg)


![100+ Azure DevOps Interview Questions and Answers [Updated 2025]](https://www.devopstraininginstitute.com/blog/uploads/images/202509/image_140x98_68c40aa9a3834.jpg)


![90+ Git and GitHub Interview Questions [2025]](https://www.devopstraininginstitute.com/blog/uploads/images/202509/image_140x98_68c40a7931d60.jpg)


![Future Scope of DevOps Careers in Pune [Updated 2025]](https://www.devopstraininginstitute.com/blog/uploads/images/202510/image_140x98_68e3a84652312.jpg)


