


![Kong Interview Preparation Guide [2025]](https://www.devopstraininginstitute.com/blog/uploads/images/202509/image_430x256_68dbb95326997.jpg)


10 Incident Response Tools Required in DevOps
Discover the ten essential incident response tools necessary for maintaining service reliability and speed in a fast-paced DevOps environment. This in-depth guide covers tools for effective monitoring, automated alerting, collaborative communication, efficient root cause analysis, and post-mortem reporting. Learn how combining these technologies empowers teams to detect, triage, mitigate, and learn from production incidents, dramatically reducing Mean Time to Detection (MTTD) and Mean Time to Resolution (MTTR). Equipping your team with these critical tools is the definitive step toward building a mature, resilient, and highly available infrastructure, securing your business against unexpected failures and ensuring continuous service uptime for users.
Introduction
In the world of DevOps, speed and change are constant. While Continuous Integration and Continuous Delivery (CI/CD) pipelines allow organizations to push new features rapidly, this velocity introduces inherent complexity and risk. The reality of modern distributed systems—built on microservices, containers, and cloud infrastructure—is that failure is not an anomaly; it is an inevitability. The true measure of a mature DevOps organization is not how often it fails, but how quickly and effectively it responds to those failures. This necessity elevates Incident Response from a mere operational task to a core business competency. Incident Response is the process that allows teams to maintain service availability, protect customer trust, and minimize financial impact when things inevitably go wrong.
An effective Incident Response framework requires more than just dedicated, skilled engineers; it relies heavily on a robust and integrated toolchain. These tools must support every phase of the incident lifecycle, from the moment a service begins to degrade to the final analysis that prevents recurrence. The right tools automate detection, centralize communication, expedite diagnosis, and capture the essential data needed for learning. Without the correct set of technologies, even the most capable teams will struggle to manage the chaos of a production outage. This guide outlines the ten essential categories of tools that every modern DevOps team must have in their arsenal to achieve superior incident management and uphold service reliability. [Image of the Incident Response Life Cycle] Adopting these tools ensures that the organizational focus can quickly shift from firefighting to remediation and prevention.
The Core Foundation: Monitoring and Alerting Systems
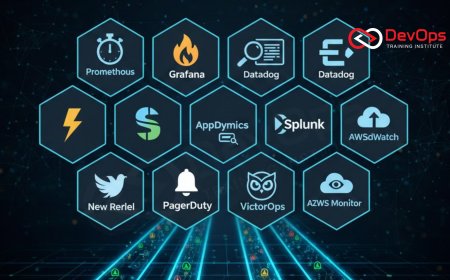
The first and most critical stage of any incident response process is detection. You cannot fix a problem you don't know exists. In a DevOps environment, where changes are deployed hundreds of times a day, traditional manual checks are useless. This is why automated, intelligent monitoring and alerting systems form the indispensable foundation of the entire incident response toolchain. These tools must not only track the health and performance of every microservice but also intelligently determine when observed behavior crosses a predefined threshold, signaling a true emergency.
Tool 1: Application Performance Monitoring (APM) and Observability Platforms (e.g., Datadog, New Relic, Dynatrace) These tools go beyond simple infrastructure monitoring. They provide deep, end-to-end visibility into application code, services, and transactions. APM tools use distributed tracing to follow a request through a complex microservices architecture, instantly identifying the service responsible for latency or error spikes. They aggregate metrics, logs, and traces into a single platform, giving responders the three pillars of observability needed for rapid root cause analysis. This holistic view is paramount for diagnosing complex problems that span multiple services and infrastructure components, dramatically cutting down the time spent determining "where" the problem lies. The ability to monitor every transaction in real-time gives teams the edge required to detect subtle degradations that precede a major outage.
Tool 2: Time-Series Monitoring and Alerting (e.g., Prometheus and Grafana) Prometheus and Grafana are the open-source power couple for monitoring cloud-native environments, and their usage is often mandatory for Kubernetes users. Prometheus scrapes time-series metrics from monitored targets, offering a powerful query language (PromQL) for defining precise alerting rules. Grafana then takes these metrics, along with data from other sources, and visualizes them into essential, real-time dashboards. This pairing is vital because it allows teams to define specific Service Level Objectives (SLOs) and immediately trigger alerts when those SLOs are violated. The combination is excellent for real-time performance tracking and ensuring that teams have complete control over the data that defines service health. This allows for proactive rather than reactive incident management, often alerting teams before users even notice a problem.
Alert Notification and On-Call Management
Once an incident is detected, the next crucial step is ensuring the alert reaches the right person, at the right time, through the right channel. In a 24/7/365 operational environment, this requires sophisticated automation that can manage rotations, escalation policies, and notification delivery across multiple channels. A failed notification means a delayed response, which directly translates to extended downtime and increased financial loss. Therefore, reliable and smart notification systems are a non-negotiable component of the DevOps toolkit.
Tool 3: Automated Alerting and On-Call Management (e.g., PagerDuty, Opsgenie, VictorOps) These dedicated on-call management platforms integrate directly with monitoring tools (like Prometheus or Datadog) to consume alerts. Their primary function is to transform a raw alert into a structured, actionable incident and ensure it reaches the assigned on-call engineer based on defined schedules and escalation policies. These tools manage complex schedules, geographic time zones, and multiple notification methods (phone calls, SMS, push notifications) to ensure acknowledgements are received swiftly. If an alert is not acknowledged within a set time frame, the system automatically escalates the incident to the next level of responders, guaranteeing that no critical alert goes unnoticed. The robust escalation logic is the lifeline of a mature incident process.
Tool 4: Incident Communication and Collaboration (e.g., Slack, Microsoft Teams, dedicated bots) During an incident, fragmented communication is a primary cause of extended outages. DevOps teams rely heavily on dedicated communication platforms to create a central, organized war room for real-time collaboration. Slack or Teams channels, often triggered automatically by the on-call tool, serve as the single source of truth for the incident. They host all technical discussions, command executions, status updates, and links to relevant dashboards and logs. Critical communication bots can be integrated to automatically document incident timelines, notify stakeholders, and execute predefined diagnostic commands. This centralization of information prevents responders from working in silos and ensures that the entire incident team is operating from the same context, dramatically improving efficiency during moments of crisis.
Diagnosis, Remediation, and Automation Tools
| Tool Category | Example Tools | Core Function in Incident Response | MTTR Impact |
|---|---|---|---|
| Centralized Logging & Analysis | Elasticsearch/Logstash/Kibana (ELK), Splunk, Datadog Logs | Aggregate all application and infrastructure logs for fast, unified searching and filtering to identify error patterns. | Significantly reduces time spent hunting for error messages across disparate hosts. |
| Runbook Automation & Execution | RunDeck, StackStorm, commercial IR platforms | Automate repetitive diagnostic and remediation actions (e.g., restarting a service, scaling up capacity). | Allows for instant, consistent, and documented execution of standard fixes, reducing human error. |
| Infrastructure and Configuration Management | Ansible, Terraform, Chef, Puppet | Ensure configuration state is immutable and allow for rapid, controlled rollbacks or re-provisioning of faulty infrastructure. | Enables reliable and fast recovery by reverting to a known good state defined by code. |
| Version Control and Deployment (Source of Truth) | GitLab, GitHub, Bitbucket | Provide the codebase for patches, allow for instant analysis of recent changes, and execute safe rollbacks. | Provides immediate context on recent code changes, often the quickest path to identifying the faulting deployment. |
| Security Information and Event Management (SIEM) | Splunk ES, Chronicle, Sumo Logic | Focuses on correlating security logs and events to detect and respond to malicious activity and security breaches. | Essential for diagnosing security incidents, which demand highly specialized and controlled response procedures. |
Once an incident is declared and the relevant team is notified, the priority shifts to diagnosis and remediation. In a distributed architecture, diagnosis is challenging because logs, metrics, and event data are scattered across potentially hundreds of machines. Effective incident response requires tools that can quickly centralize and process this massive stream of data, turning noise into actionable information. Automation is also key; the fastest resolution is the one executed by a machine in seconds, not a human in minutes.
Tool 5: Centralized Logging and Analysis (e.g., ELK Stack, Splunk) The centralization of logs is arguably the most powerful diagnostic tool available to a responder. The ELK stack (Elasticsearch, Logstash, Kibana) or commercial alternatives like Splunk aggregate all log data from applications, infrastructure components, and network devices into a single, searchable repository. This allows responders to quickly trace a request, filter error messages, and look for patterns across the entire system at the time of the incident. Without centralized logging, engineers are forced to manually SSH into servers to hunt for logs, a time-consuming and error-prone process that drastically increases Mean Time to Resolution (MTTR). The ability to search millions of log lines in milliseconds is fundamental to a fast diagnosis. This centralized approach also assists in ensuring secure and auditable access to critical log data.
Tool 6: Runbook Automation and Automated Remediation (e.g., RunDeck, commercial IR platforms) Runbook automation tools bridge the gap between human decision-making and system execution. They allow teams to encode standard operational procedures (runbooks) into reusable, executable workflows. For example, the action to "restart the caching layer" or "scale up the API gateway deployment" can be executed by a single click or command, securely and consistently. This eliminates the risk of human error during high-stress situations and immediately lowers MTTR by executing routine fixes faster than any human could. These tools are often integrated into incident management platforms, allowing the on-call engineer to trigger a documented, safe remediation action directly from the incident war room, proving invaluable when minutes count.
Post-Incident Analysis and Prevention
The incident response process is incomplete without the final, crucial step: learning and prevention. A successful response minimizes downtime, but a truly mature DevOps team uses every incident as a critical learning opportunity to improve system resilience and prevent future occurrences. This requires dedicated tools for structured documentation and analysis, ensuring that valuable operational knowledge is captured and integrated back into the development lifecycle. The goal is to continuously harden the system, making the next incident smaller, less frequent, and easier to resolve.
Tool 7: Knowledge Base and Documentation (e.g., Confluence, Wiki, dedicated IR documentation) Every incident response toolchain needs a dedicated, accessible repository for storing runbooks, troubleshooting guides, system architecture diagrams, and post-mortem documents. A comprehensive knowledge base ensures that responders—especially those new to the team or the affected service—have immediate access to the collective operational wisdom of the organization. Poor documentation is a primary bottleneck during diagnosis, forcing engineers to waste time rediscovering information. Using tools like Confluence, where documentation is linked directly to service repositories and incident tickets, ensures that critical system roles and configurations are instantly understood and leveraged for faster resolution. A well-maintained knowledge base is the foundation of a proactive incident strategy.
Tool 8: Post-Mortem and Tracking (e.g., Jira, dedicated incident review tools) The post-mortem process is where the true organizational learning takes place. This process requires a structured tool, usually an issue tracker like Jira or a dedicated feature within a commercial incident platform, to capture all details of the incident: the timeline, the root cause (often determined using the "Five Whys"), the impact, and the resulting list of actionable items (often called "action items" or "remediation tasks"). These remediation tasks—such as fixing a bug, improving an alert, or adding a circuit breaker—must be formally tracked and prioritized alongside feature development work. Without a dedicated tracking tool, these crucial preventative tasks often fall through the cracks, leading to repeat incidents, effectively rendering the entire incident response effort partially wasted. This is the mechanism by which operational toil is transformed into enduring system improvements.
System Resilience and Backup Verification Tools
Prevention is always better than cure, and in the DevOps world, prevention is intrinsically linked to the resilience and recoverability of the underlying infrastructure. A robust incident response plan must include tools and practices that verify the system's ability to self-heal and recover quickly from catastrophic failure. This focus on recoverability is key to minimizing the blast radius of any incident, ensuring that even if a service fails, a known good state can be restored instantly. This requires continuous testing of recovery procedures.
Tool 9: Backup and Recovery Automation (e.g., rsync, dedicated backup solutions) While not a direct response tool, reliable backup and recovery automation is the ultimate safety net during a data-loss or configuration-drift incident. Tools like rsync paired with cron for scheduling, or more sophisticated cloud-native solutions, must ensure that critical data and configuration artifacts are constantly archived and immediately available for restoration. The ability to restore a database to a point-in-time or revert a configuration to a previously stable version is often the fastest path to resolving a major incident. Furthermore, the practice of regularly testing these recovery processes, often using dedicated tools or scripts, ensures that the recovery itself does not become the next incident. Having a verified, tested backup ensures the team can follow best practices for backup recovery, guaranteeing data integrity and fast rollback.
Tool 10: Chaos Engineering Platforms (e.g., Chaos Monkey, Gremlin, LitmusChaos) Chaos Engineering is the practice of intentionally introducing failure into the system to prove its resilience. Platforms like Gremlin or LitmusChaos allow teams to safely and systematically test how their services respond to real-world conditions, such as high CPU load, network latency, or service termination. While this sounds counter-intuitive, it serves as a powerful incident prevention tool. By routinely running "game days" and chaos experiments, teams discover weaknesses, fix them, and harden their monitoring and alerting BEFORE a real incident occurs. This shift from reactive response to proactive experimentation ensures that when a real-world incident strikes, the team's tools, runbooks, and, most importantly, their systems have already been battle-tested under similar conditions.
Conclusion
Effective incident response is the ultimate measure of operational maturity in a DevOps environment. It is the critical process that turns the risk of rapid deployment into the benefit of rapid recovery, safeguarding service availability and user trust. The ten categories of tools discussed—ranging from the foundational alerting of PagerDuty and the diagnostic power of the ELK stack, to the proactive resilience testing of Chaos Engineering platforms—form a robust, integrated ecosystem. No single tool solves the problem; success comes from the seamless automation and integration between them, ensuring that the detection, triage, mitigation, and learning phases of the incident lifecycle are executed with maximum speed and precision. Teams that invest in this comprehensive toolchain not only reduce their Mean Time to Resolution but also transform operational chaos into continuous organizational learning, driving lasting improvements in system resilience and reliability. By embracing these tools, DevOps teams secure their services and cement their role as critical enablers of business success.
Frequently Asked Questions
What is the primary goal of incident response in DevOps?
The primary goal is to minimize Mean Time to Resolution (MTTR) and Mean Time to Detection (MTTD) to ensure continuous service availability for users.
What are the three pillars of observability?
The three pillars of observability are metrics, logs, and traces, all required for holistic system understanding and fast root cause analysis.
How does PagerDuty contribute to incident response?
PagerDuty manages on-call schedules, escalations, and automated notifications to ensure critical alerts reliably reach the correct responder immediately.
What is the benefit of a centralized logging tool like ELK?
Centralized logging allows responders to search, filter, and correlate millions of log lines from all services in one place, expediting diagnosis.
Why is runbook automation crucial for incident mitigation?
Runbook automation allows for instant, consistent, and secure execution of standard, repetitive fixes, reducing human error and MTTR significantly.
What is Chaos Engineering's role in incident response?
Chaos Engineering proactively tests system resilience by safely introducing failures, allowing teams to fix weaknesses before they cause real incidents.
How does Git help during an active incident?
Git provides the precise history of code and configuration changes, often pointing directly to the faulting commit that caused the incident, speeding diagnosis.
What is the difference between monitoring and observability?
Monitoring tells you if the system is up, while observability allows you to ask arbitrary questions about why the system is behaving a certain way.
What happens in the post-mortem phase of an incident?
The post-mortem phase documents the incident timeline, determines the root cause, and generates action items to prevent future recurrences.
How does the incident toolchain improve team collaboration?
It improves collaboration by providing a single, centralized communication channel (war room) where all status updates and diagnostic data are shared.
What is the importance of having a knowledge base during an incident?
The knowledge base provides immediate access to documented runbooks and troubleshooting guides, reducing time wasted searching for information.
How do microservices complicate incident response?
Microservices complicate response by creating a distributed system where failures can cascade, making it harder to pinpoint the original source of the error.
What is the benefit of continuous backup verification?
Continuous verification ensures that the recovery process itself will succeed in a crisis, guaranteeing the fastest and most reliable path to data and service restoration.
What is SIEM used for in incident response?
SIEM is used for correlating security events and logs across the environment to detect and manage potential security breaches or malicious activity effectively.
What role does an APM tool's distributed tracing play in diagnosis?
Distributed tracing precisely tracks a request across service boundaries, instantly highlighting the component or service where performance degradation is occurring.
What's Your Reaction?
 Like
1
Like
1
 Dislike
0
Dislike
0
 Love
0
Love
0
 Funny
0
Funny
0
 Angry
0
Angry
0
 Sad
0
Sad
0
 Wow
0
Wow
0
![100+ Azure DevOps Interview Questions and Answers [Updated 2025]](https://www.devopstraininginstitute.com/blog/uploads/images/202509/image_140x98_68c40aa9a3834.jpg)


![Future Scope of DevOps Careers in Pune [Updated 2025]](https://www.devopstraininginstitute.com/blog/uploads/images/202510/image_140x98_68e3a84652312.jpg)


