


![Kong Interview Preparation Guide [2025]](https://www.devopstraininginstitute.com/blog/uploads/images/202509/image_430x256_68dbb95326997.jpg)


12 DevOps Tools for Predictive Monitoring
Explore 12 essential DevOps tools that enable predictive monitoring, helping you anticipate system failures, resource exhaustion, and performance bottlenecks before they impact users. This guide covers how to leverage AI/ML-powered APM solutions, advanced observability platforms, log analytics, and statistical modeling tools to shift from reactive incident response to proactive operations. Learn how these tools integrate with CI/CD and infrastructure management to ensure service reliability, maintain high performance, and drastically reduce Mean Time to Restore (MTTR) in complex, cloud-native environments, accelerating your operational maturity.
Introduction
In modern, high-velocity DevOps environments, the traditional approach to monitoring—reacting to alerts after a failure has already occurred—is a recipe for disaster. Predictive monitoring, often associated with AIOps (Artificial Intelligence for IT Operations), represents the necessary evolution. It’s the practice of using advanced statistical analysis, machine learning (ML), and intelligent automation to analyze real-time and historical data (metrics, logs, traces) to anticipate system failures, performance degradation, and resource exhaustion before they impact service reliability or the end-user experience.
The goal of predictive monitoring is to shift the operational paradigm from firefighting to forecasting. By identifying subtle patterns, trends, and anomalies that human operators might miss, these tools enable teams to proactively intervene—whether by scaling up resources, rolling back a deployment, or optimizing a database query—before a critical threshold is crossed. This capability is vital for managing the complexity and dynamic scaling of cloud-native and microservices architectures, where a single failure can cascade rapidly across dozens of interdependent services.
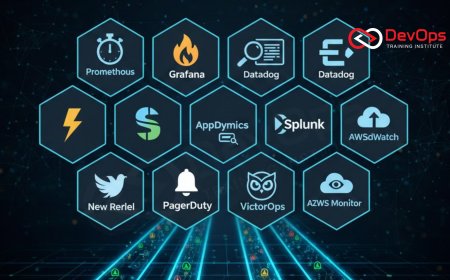
This guide highlights 12 essential DevOps tools that provide or enable advanced predictive monitoring capabilities. We categorize them based on their core function: Data Collection and Analysis, AIOps Platforms, and Code/Infrastructure Validation. By integrating tools from these categories, you can build a comprehensive strategy for continuous optimization and proactive operations, ensuring high availability and accelerating your journey toward operational excellence.
Pillar I: Data Collection and Correlation (The Observability Foundation)
Predictive monitoring is only as good as the data it consumes. The first set of tools establishes the necessary foundation by collecting high-fidelity metrics, logs, and traces, and providing the correlation needed for advanced analysis. These tools are the essential "eyes and ears" of the system, transforming raw output into actionable data streams.
1. Prometheus (Metrics and Time-Series Analysis)
Prometheus is the de facto open-source standard for collecting time-series metrics. Its dimensional data model and powerful query language (PromQL) are essential for trending, alerting, and identifying historical patterns. While Prometheus alerts on static thresholds (reactive), its ability to collect and store vast amounts of historical data is foundational for feeding ML-based predictive tools.
Predictive Role: Provides the historical baseline data required for statistical forecasting and is often used to calculate metrics like saturation and utilization, which are key leading indicators of future failure. Its robust data model allows for efficient correlation of infrastructure metrics with application performance metrics.
2. Grafana (Visualization and Anomaly Baselines)
Grafana is the visualization engine that turns metric data into actionable dashboards. For predictive monitoring, Grafana allows engineers to visually compare current performance against historical trends and establish dynamic baselines. Many Grafana plugins and extensions also incorporate basic statistical functions to highlight deviations from the norm, indicating a potential anomaly before a hard alert is triggered.
Predictive Role: Essential for visualizing leading indicators (like P99 latency growth or resource consumption trends), allowing human operators to manually identify performance degradation before a full outage occurs. It helps establish and visualize the "normal" behavior that anomaly detection models need to learn.
3. ELK/Elastic Stack (Log Analytics and Pattern Recognition)
The Elastic Stack (Elasticsearch, Logstash, Kibana) is a powerhouse for log management and unstructured data analysis. Predictive monitoring uses the ELK stack to analyze log data for repetitive or unusual error patterns, such as a sharp increase in non-critical warnings or a recurring sequence of events that previously led to a crash. Tools within the Elastic stack, like machine learning job features, can detect these log anomalies automatically.
Predictive Role: Provides deep, textual context and pattern recognition. Analyzing logs for log management best practices and anomaly allows the system to predict failures that don't immediately manifest as metric spikes but are precursors to critical errors, such as a database connection pool exhausting resources.
Pillar II: AI/ML-Powered Platforms (AIOps Core)
These specialized platforms use proprietary or open-source machine learning algorithms to automate the analysis of the collected data (metrics, logs, traces). They are the core of true predictive monitoring, moving beyond simple static thresholds to dynamic baselines and automated root cause analysis.
4. Dynatrace (AI-Powered APM)
Dynatrace is a leading Application Performance Monitoring (APM) platform known for its causal AI engine, Davis. Dynatrace automatically discovers all components of a cloud-native architecture and continuously learns the normal operational baseline. It provides automatic, predictive alerting on deviations and, critically, performs automated root cause analysis by correlating metric, trace, and log data across the entire stack, significantly reducing MTTR.
Predictive Role: Uses ML to detect anomalies in real-time, predict resource saturation, and automatically identify the relationships between application errors and infrastructure changes, often predicting outages hours before they become critical.
5. AppDynamics (Application Intelligence)
AppDynamics (Cisco) also uses machine learning to establish dynamic baselines for application performance, defining what constitutes "normal" behavior for every transaction and service. Its predictive capabilities focus heavily on deep application code visibility, detecting anomalies in business transactions, and forecasting performance issues that affect user experience.
Predictive Role: Focuses on the business impact of performance degradation, predicting when slow transactions will violate service level objectives (SLOs) and providing code-level insights for remediation. It's an essential tool for correlating operational performance with financial or business outcomes.
6. Splunk (Observability Cloud)
Splunk leverages its massive data ingestion and search capabilities across its Observability Cloud to provide robust predictive analytics. Its ML Toolkit is used to perform statistical analysis, forecasting, and clustering of monitoring events, helping to anticipate operational risks, manage capacity, and filter alert noise for on-call teams.
Predictive Role: Excellent for centralized analysis across hybrid environments. Splunk's ML features can identify subtle, slow-growing trends in resource utilization or network latency that signal future resource exhaustion or dependency failures, enabling proactive capacity planning.
7. OpenNMS Horizon (Statistical Analysis)
OpenNMS Horizon is a powerful open-source network and performance management platform. While not a dedicated AIOps tool, it includes advanced features like flow analysis and performance thresholding based on historical data. It uses statistical models to forecast resource usage and predict when performance will breach a target SLO based on current trends.
Predictive Role: Utilizes advanced statistical methods for forecasting resource growth and service degradation, allowing teams to anticipate when resource constraints will require human intervention, such as when a cluster requires scaling or a host needs maintenance. Its predictive analytics is a foundational element for capacity planning.
Pillar III: Code and Infrastructure Validation
True prediction extends beyond just runtime analysis; it involves predicting the operational impact of code and infrastructure changes before they are deployed. These tools integrate directly into the CI/CD pipeline to analyze the risk and health of the deployment artifact itself.
8. Security Static Analysis (SAST/SCA Tools)
Tools like SonarQube, Snyk, and Checkmarx perform Static Application Security Testing (SAST) and Software Composition Analysis (SCA). While primarily focused on security, they act as predictive tools by identifying security flaws (SAST) or vulnerable dependencies (SCA) that are highly likely to cause failures or compromises in production.
Predictive Role: Predicts future security incidents by identifying high-risk code or dependencies in the CI pipeline. This preemptive identification, enforced as a security gate, is the ultimate form of prediction, preventing catastrophic failures related to zero-day exploits or common coding vulnerabilities. This is essential for continuous threat modeling.
9. Infrastructure as Code (IaC) Policy Analyzers
Tools like Checkov, Terrascan, and Open Policy Agent (OPA) analyze Terraform or Kubernetes manifests before they are applied. These tools predict operational failure by identifying infrastructure misconfigurations (e.g., open security groups, lack of replicas, or using insecure base images) that will lead to security breaches or instability once provisioned.
Predictive Role: Predicts infrastructure failure and security compromise by validating the IaC against compliance and best practice policies. This ensures that the foundation of the environment is secure and correctly configured, aligning with strict security requirements like those in RHEL 10 security enhancements, before any application is deployed onto it.
10. Infracost (Cost Prediction)
Infracost provides cloud cost estimation based on Terraform plans. While not a performance tool, it is critical for FinOps, predicting the financial impact of infrastructure changes. Preventing unbudgeted cost overruns is a form of operational resilience and a key predictive function in modern DevOps.
Predictive Role: Predicts future financial risk and budget overruns by calculating the estimated monthly cost of resources defined in IaC, allowing teams to optimize for cost before the infrastructure is provisioned.
11. Canary Analysis Tools (Spinnaker/Argo Rollouts)
Tools like Spinnaker and Argo Rollouts (using the Argos project) automate Canary Deployment analysis. They deploy a new version to a small subset of users and continuously monitor its real-time performance metrics against the stable baseline. Their ML-driven analysis predicts whether the new version is likely to fail in production, halting the rollout instantly if anomalies are detected.
Predictive Role: Provides near real-time prediction of deployment risk, using live production data to validate the safety of a new release. This is the ultimate gate for ensuring that code changes do not degrade the live service, a key part of managing the release cadence safely.
12. Gremlin / Chaos Mesh (Proactive Failure Testing)
Gremlin and Chaos Mesh are tools for Chaos Engineering. While they inject failure (reactive), their purpose is entirely predictive. By proactively simulating outages (e.g., latency injection, CPU exhaustion, network partition), they test the system's resilience and surface unknown weaknesses, predicting where the system will fail under stress conditions that are likely to occur in the future.
Predictive Role: By forcing a failure, they predict and reveal system weaknesses and misconfigurations that traditional monitoring would not catch. The results of a chaos experiment predict the system's Mean Time to Recovery (MTTR) and highlight necessary code changes (e.g., implementing circuit breakers or retries) to improve future resilience, which is essential for robust operations.
Conclusion
Predictive monitoring is the future of reliable operations in DevOps. It demands a tightly integrated toolchain where foundational observability data (metrics, logs, traces) is continuously analyzed by sophisticated AIOps platforms. The 12 tools outlined here—ranging from the data collection prowess of Prometheus and the deep learning of Dynatrace to the preemptive checks of Checkov and the risk mitigation of Spinnaker—provide the blueprint for achieving this proactive state.
The strategic implementation of these tools allows teams to transcend static threshold alerting and embrace dynamic baselines, anomaly detection, and capacity forecasting. By shifting risk validation left (using SAST, IaC analyzers) and embedding predictive analysis into the deployment workflow (Canary Analysis), you ensure that your code is not only clean but also operationally sound before it ever affects the end-user. This commitment to continuous, proactive validation is the hallmark of operational excellence in the cloud-native era.
Ultimately, predictive monitoring drastically reduces operational toil, shortens MTTR, and elevates the DevOps team's role from reacting to current crises to proactively ensuring future stability. By utilizing these tools to correlate security posture, code quality, and performance trends, you build a resilient, self-optimizing platform that can scale confidently in the face of rapid change, ensuring that your high-velocity continuous delivery remains both fast and highly reliable.
Frequently Asked Questions
What is the difference between AIOps and traditional monitoring?
Traditional monitoring uses static thresholds for alerts, while AIOps uses ML and statistical analysis on historical data to anticipate and predict failures before they happen.
How does Prometheus contribute to predictive monitoring if it uses static alerts?
Prometheus provides the high-fidelity, historical time-series metric data that is essential for feeding the ML models used by dedicated AIOps and predictive platforms.
What role does an APM tool like Dynatrace play in prediction?
Dynatrace uses causal AI to automatically learn normal baselines across the stack, detecting subtle deviations and correlating them across services to predict an impending outage.
How does continuous threat modeling relate to predictive tools?
Threat modeling informs SAST/SCA rules, which are predictive tools, by ensuring they check for code patterns that are most likely to lead to security vulnerabilities and breaches in production.
How do IaC Policy Analyzers (Checkov, OPA) enable prediction?
They predict operational failure by analyzing infrastructure code for misconfigurations (e.g., open ports, missing replicas) that would inevitably lead to security or availability problems after provisioning.
What is a key predictive function of Infracost?
Infracost predicts future financial risk by calculating the estimated cost of resources defined in a Terraform plan, allowing teams to prevent budget overruns before deployment.
What is the predictive function of Canary Analysis tools like Spinnaker?
They use live traffic metrics from a small new deployment to predict the overall success or failure of the new version if fully rolled out, stopping bad deployments instantly to manage the release cadence safely.
How does Chaos Engineering contribute to predictive monitoring?
By proactively injecting failures (latency, CPU exhaustion), chaos engineering reveals unknown weaknesses and predicts the system's MTTR under stress, guiding resilience improvements.
Why is RHEL 10 security enhancements validation relevant to predictive monitoring?
The CI/CD pipeline should predict host failure by verifying that the underlying operating systems are securely configured and hardened, preventing future security incidents that start at the host layer.
How does observability pillars data fuel predictive analytics?
Predictive tools ingest data from all three pillars (metrics, logs, traces) to build holistic baselines and correlate subtle anomalies across different data types, enabling accurate forecasting of failures.
How does Splunk utilize its ML Toolkit for predictive monitoring?
Splunk uses ML to perform statistical analysis, forecasting, and clustering of monitoring events, helping to anticipate operational risks, manage capacity, and filter alert noise effectively.
How do security SAST tools act as predictive tools?
They predict future security incidents by identifying high-risk coding vulnerabilities in the source code before the application is ever deployed, preventing exploitation in the live environment.
Why is log management best practices crucial for ML-driven prediction?
ML models require clean, structured log data for pattern recognition to predict failures that are only visible as subtle, repetitive errors in the log stream before they become critical.
What is the difference between a static alert and a dynamic baseline alert?
A static alert triggers when a value hits a fixed number (e.g., CPU > 90%). A dynamic baseline alert triggers when a value deviates significantly from the ML-learned historical norm (e.g., latency spikes 5% above the typical Tuesday morning baseline).
What is the ultimate benefit of predictive monitoring for a DevOps team?
It enables proactive intervention, drastically reduces MTTR, improves service reliability, and shifts the team's focus from reactive firefighting to strategic optimization and innovation.
What's Your Reaction?
 Like
0
Like
0
 Dislike
0
Dislike
0
 Love
0
Love
0
 Funny
0
Funny
0
 Angry
0
Angry
0
 Sad
0
Sad
0
 Wow
0
Wow
0
![100+ Azure DevOps Interview Questions and Answers [Updated 2025]](https://www.devopstraininginstitute.com/blog/uploads/images/202509/image_140x98_68c40aa9a3834.jpg)


![Future Scope of DevOps Careers in Pune [Updated 2025]](https://www.devopstraininginstitute.com/blog/uploads/images/202510/image_140x98_68e3a84652312.jpg)


