


![Kong Interview Preparation Guide [2025]](https://www.devopstraininginstitute.com/blog/uploads/images/202509/image_430x256_68dbb95326997.jpg)


12 Kubernetes Logging Tools for Application Insights
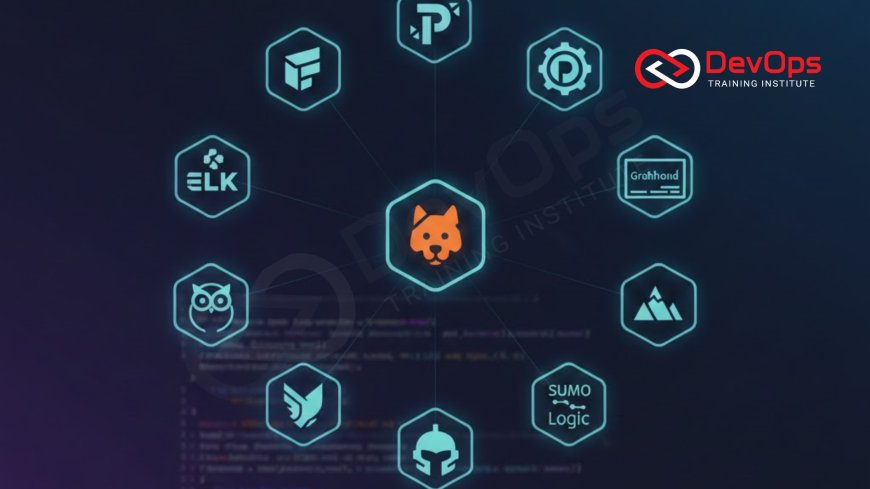
Master the challenge of log management in complex, distributed systems with the 12 best Kubernetes logging tools. This guide explores essential solutions across the logging pipeline, from lightweight collectors like Fluent Bit and vector to centralized analysis platforms like the ELK Stack, Loki, and commercial observability suites. Learn how to aggregate, filter, and analyze massive volumes of container logs, gaining crucial Application Insights for rapid troubleshooting, performance optimization, and robust compliance. Choosing the right logging stack is paramount for achieving operational excellence and maintaining the stability of your cloud-native applications today, simplifying the process of transforming raw data into actionable intelligence for your DevOps team.
Introduction
Kubernetes, the industry-standard platform for orchestrating containerized applications, has revolutionized deployment scalability and efficiency. However, this power comes with a significant operational challenge: log management. Traditional logging methods fail miserably in a Kubernetes environment where applications are distributed across dozens of nodes, containers are constantly spinning up and down (ephemeral), and raw log data is often scattered across multiple layers (container, host, and application). To effectively troubleshoot a failed service, diagnose a performance bottleneck, or perform security forensics, DevOps Engineers must rely on a centralized, resilient, and highly efficient logging pipeline capable of handling massive volumes of unstructured data.
Effective logging is the first of the three pillars of observability (logs, metrics, and traces) and is crucial for extracting meaningful Application Insights from complex distributed systems. Logs provide the granular, event-level detail necessary for root cause analysis, showing exactly what happened and when. Without a structured logging solution, logs are lost when a container dies, leaving engineers blind during critical production incidents. This guide details 12 essential Kubernetes logging tools—from lightweight collectors that run on every node to powerful backend analysis engines—that, when combined, form a world-class, production-ready observability stack for any cloud-native environment, moving beyond simple data collection to deliver actionable intelligence for application development and operational teams alike.
The strategic selection of these tools is based on optimizing three core stages: Collection (extracting logs from the ephemeral containers), Aggregation/Storage (centralizing and indexing the data reliably), and Analysis/Visualization (making the data searchable and understandable). Mastery of this pipeline ensures that engineers can quickly pinpoint the exact cause of system anomalies, improving the Mean Time to Repair (MTTR) and maintaining the high availability standards that modern microservices architectures demand.
Phase 1: Log Collectors and Forwarders (The Lightweight Agents)
Log collectors are the first line of defense, responsible for ensuring that log streams from application containers are reliably captured from the host node and forwarded off-cluster to a centralized storage backend before the ephemeral container dies and its data is lost. In Kubernetes, these collectors are typically deployed as a DaemonSet, meaning one instance of the agent runs on every worker node to collect all local logs. Their design priority is high throughput and minimum resource consumption (low overhead), ensuring the logging process itself does not degrade application performance.
The top tools in this category include:
1. Fluent Bit: The industry-leading lightweight log collector and processor, which is officially a Cloud Native Computing Foundation (CNCF) project. Optimized for high performance and low resource usage, Fluent Bit is the preferred choice for collecting container logs in resource-constrained environments like Kubernetes. It efficiently collects logs, filters them, and reliably forwards them to various backends (Elasticsearch, Kafka, S3), providing necessary security and data processing capabilities directly at the cluster node level.
2. Fluentd: The upstream sibling to Fluent Bit and also a CNCF project, Fluentd is a more powerful, robust data collector used primarily as a central router or aggregator. While Fluent Bit is deployed as the lightweight agent on every node, Fluentd is often used as the central relay point, receiving data from multiple Fluent Bit instances and performing complex routing, advanced filtering, and large-scale data aggregation before final storage. Its vast plugin ecosystem allows it to integrate with virtually any data source or destination imaginable.
3. vector: A high-performance, vendor-neutral observability data router and processor that is quickly gaining popularity. vector is designed to handle logs, metrics, and traces, offering superior data processing capabilities and reliability compared to older forwarders. Its focus on efficiency and safety makes it an excellent choice for modern DevOps teams that need a single, consistent tool to manage all three pillars of observability data across their cloud environment, simplifying the data aggregation pipeline.
The choice between these forwarders often depends on the complexity of the processing required. For simple collection on the worker nodes, Fluent Bit is usually preferred for its low overhead. For complex transformations, enrichment, or routing between multiple backends, Fluentd or vector may be deployed either on the nodes or as central collection points within the cluster to ensure that the application logs are correctly formatted and enriched with essential metadata like Pod name, namespace, and container ID.
Phase 2: Centralized Storage and Indexing (The Backends)
Once logs are collected, they must be indexed and stored in a centralized, durable repository optimized for high-speed searching and analysis. This backend is where the raw log data is transformed into searchable intelligence that engineers can query to find specific events, errors, and traces across the entire history of the application. The selection of the right backend depends on factors like data volume, query complexity requirements, and budgetary constraints, often requiring a strategic decision on whether to opt for open-source flexibility or managed service simplicity.
4. Elasticsearch (ELK Stack - Storage): The foundation of the widely used ELK (Elasticsearch, Logstash, Kibana) Stack, Elasticsearch is a distributed, RESTful search and analytics engine known for its ability to handle massive volumes of log data and execute complex, full-text searches in near real-time. It provides the scalable, durable storage layer for most large-scale, self-hosted Kubernetes logging solutions. Engineers leverage its indexing power to search logs based on complex criteria, making it a critical tool for detailed forensic analysis.
5. Loki (Grafana Labs): A horizontally scalable, multi-tenant log aggregation system designed specifically for Kubernetes and cloud-native applications. Loki is unique in that it indexes only the metadata (labels) associated with the logs rather than the full-text content. This significantly reduces storage costs and improves query performance, especially when paired with Prometheus labels. Loki is often paired with its lightweight collector, Promtail (or Fluent Bit/vector), and is visualized via Grafana, making it a highly resource-efficient and cost-effective logging solution for teams already invested in the Prometheus monitoring ecosystem.
6. Cloud-Native Log Services (AWS CloudWatch, Azure Monitor, GCP Cloud Logging): For teams committed to a single cloud provider, the native services offer immediate, deep integration with managed Kubernetes offerings (EKS, AKS, GKE). These services automatically collect, process, and store container logs with zero setup complexity. They often integrate natively with other cloud monitoring and security tools, streamlining the observability stack. Their ease of use and abstraction of the storage layer are significant benefits, though they may lack the customizability or multi-cloud portability of open-source solutions.
Phase 3: Analysis and Visualization (The Frontend)
The final and most crucial phase is turning raw log data into understandable, actionable Application Insights. The visualization layer provides the interface for engineers to query, analyze, dashboard, and set up alerts based on log patterns and anomalies. This is where the time and effort invested in collection and storage pays off, empowering rapid root cause analysis and proactive system management, reducing the time required to detect and fix production issues.
7. Kibana (ELK Stack - Visualization): The visualization and analysis frontend for Elasticsearch. Kibana provides intuitive dashboards, powerful querying capabilities (using Elasticsearch's Query DSL), and real-time data exploration features that allow engineers to visualize log data trends, identify anomalies, and drill down into specific events across their massive log archives. It is the necessary bridge between raw data and actionable intelligence for ELK users.
8. Grafana (Visualization/Dashboards): While traditionally known for metrics visualization with Prometheus, Grafana is also an excellent, multi-source log visualization tool that natively integrates with Loki and Elasticsearch. Its "Explore" feature allows engineers to seamlessly switch between metrics and logs for the same time range and label set, enabling a powerful correlation of performance data with application events, which is essential for diagnosing issues in complex, distributed systems and adhering to SRE principles.
9. Promtail: The lightweight log collector deployed on Kubernetes nodes designed specifically to work with Loki. Promtail acts as the agent that discovers application logs, adds relevant Prometheus labels (such as `namespace`, `pod`, and `container`), and pushes them directly to the Loki instance. It ensures that logs are efficiently indexed and easily searchable using the same labeling system used for metrics, creating a powerful, unified observability experience.
| # | Tool | Category | Primary Function in K8s | Backend Target |
|---|---|---|---|---|
| 1 | Fluent Bit | Collector/Forwarder | Lightweight log collection from every node. | Elasticsearch, Loki, S3, Cloud Services |
| 3 | vector | Collector/Router | High-performance, multi-data-type router and log processor. | Any destination (Elasticsearch, Loki, Splunk) |
| 4 | Elasticsearch | Storage/Indexing | Scalable, distributed, full-text log search and storage engine. | Self-Managed or Cloud Service |
| 8 | Grafana | Visualization/Analysis | Unified dashboarding and query interface for logs (Loki) and metrics (Prometheus). | Loki, Elasticsearch, Prometheus |
Phase 4: Commercial and Enterprise Observability Suites
For large enterprises, particularly those that prioritize operational simplicity, integrated security features, and machine learning-powered anomaly detection, commercial observability platforms provide a compelling alternative to managing complex open-source stacks. These tools often bundle logs, metrics, and tracing into a single agent and interface, simplifying setup and improving the correlation of data, which is essential for diagnosing issues in complex, distributed systems at enterprise scale, and offering guaranteed service-level agreements (SLAs).
10. Datadog: A leading commercial SaaS observability platform that provides a single interface for infrastructure monitoring, APM (Application Performance Monitoring), and log management. Its unified agent automatically collects logs, metrics, and traces from Kubernetes clusters and correlates them seamlessly, allowing engineers to jump directly from a performance metric alert to the corresponding application log for root cause analysis. Datadog's robust querying and alerting capabilities make it a strong, low-maintenance option for mature DevOps teams.
11. Splunk: An industry veteran known for its powerful search processing language (SPL) and scalability in handling massive volumes of machine data. Although often more expensive, Splunk is favored by enterprises, particularly in regulated industries like finance and healthcare, for its deep forensic analysis capabilities, security information and event management (SIEM) features, and its ability to handle long-term retention and complex compliance auditing requirements. Its Kubernetes integration ensures reliable collection across large clusters.
12. Logz.io: This platform offers the popular ELK Stack (Elasticsearch, Logstash, Kibana) as a fully managed, enterprise-ready service, eliminating the operational burden of managing the underlying database cluster and offering the familiar open-source toolset with added features. Logz.io layers on machine learning, AI-powered anomaly detection, and sophisticated proactive alerting, making it a strong choice for teams who prefer the flexibility of the open-source tools but require the stability, support, and enhanced features of a commercial platform for their mission-critical Application Insights.
Phase 5: Ensuring Log Integrity and Structure
Regardless of the toolset chosen, the effectiveness of Kubernetes logging hinges on adhering to two key principles: consistency and structure. Logs must be reliably captured and formatted so that they can be efficiently indexed and queried across the cluster. Engineers should understand how log data flows from the application container to the final storage backend, ensuring no data loss occurs along the path.
It is crucial to implement Structured Logging within the application code itself, ensuring that logs are emitted as JSON rather than raw text. This allows collectors (like Fluent Bit) to efficiently parse the data and retain its valuable key-value pairs (e.g., `user_id`, `latency`, `request_id`). Structured logging drastically improves searchability and enables sophisticated querying, turning raw data into meaningful metrics and intelligence for immediate operational use. When logs are structured, engineers can quickly pivot from an error count to a list of specific user requests that triggered the error, making troubleshooting exponentially faster and more precise.
Furthermore, log collection must account for the specific environment in which the logs are being generated. In Kubernetes, containers typically log to stdout and stderr, which are captured by the container runtime and then written to a file on the worker node's disk (usually in `/var/log/containers/`). The log forwarder (the DaemonSet agent) then tails these files. Understanding this file system hierarchy and the persistence layer is key to diagnosing issues where the forwarder may be failing or where logs may be being lost due to disk space issues on the host machine. This knowledge is an application of fundamental Linux system administration skills in a modern cloud context, guaranteeing log integrity from source to destination.
Phase 6: Advanced Logging Practices for Microservices
For complex microservices architectures, basic collection and storage are insufficient. Advanced logging practices are required to connect distributed events and enable a holistic understanding of application behavior across multiple services and transactions. These techniques are often crucial for maintaining high reliability and performance in high-traffic production environments where individual requests traverse many different network components.
Log Correlation: This involves injecting a unique Trace ID into every incoming request at the entry point (e.g., the API Gateway or Ingress Controller) and ensuring that this ID is carried forward and logged by every downstream microservice involved in processing that transaction. This practice allows an engineer to search the centralized logging platform for a single ID and instantly retrieve every log line, across every container and service, related to that one transaction, turning what would be a multi-hour manual investigation into a single, efficient query. This technique is often seen as the essential link between logs and the tracing pillar of observability.
Enrichment and Metadata: Before logs reach the backend, the collector (e.g., Fluent Bit or Fluentd) must automatically enrich the log stream with valuable Kubernetes metadata, including the Pod name, Namespace, Cluster ID, and associated deployment labels. This enrichment ensures that when an engineer searches for a specific error, they can immediately filter and identify which application version, feature branch, or geographical region the error occurred in, making the data directly actionable for remediation and root cause analysis. This process transforms simple log lines into comprehensive, context-rich data points, fulfilling the promise of extracting true Application Insights from raw data.
7. The Unification of Logs and Metrics
The most advanced and effective Kubernetes observability stacks unify logs and metrics under a single control plane, allowing for seamless correlation between the two. Tools like Loki and Grafana have pioneered this approach by using the same label set (metadata) for both logs (stored in Loki) and metrics (stored in Prometheus). If an alert fires based on a metric (e.g., CPU utilization is high, or latency is spiking), the engineer can click directly into the Grafana dashboard and instantly view the corresponding log lines from the affected Pods for the same time frame, accelerating incident response and root cause analysis by minimizing the time spent navigating between disparate monitoring systems and consoles.
8. Security and Compliance Logging
Security logging in Kubernetes involves not just application data but also audit trails for the cluster itself. The Kubernetes API Server generates detailed audit logs that track every action performed against the cluster (who did what, and when). DevOps Engineers must ensure these critical security logs are reliably collected and stored in the centralized logging system, often segregated for security analysis and compliance auditing. These audit logs are vital for forensic analysis, identifying insider threats, and proving adherence to regulatory standards (e.g., HIPAA, PCI DSS), making log management a core component of the cluster's overall security posture. Tools like Fluent Bit can specifically configure routes to send these sensitive audit logs to secure, long-term archives.
Conclusion
Effective log management is the cornerstone of operational excellence and rapid troubleshooting in any Kubernetes environment. The complexity of distributed microservices and ephemeral containers necessitates a strategic, layered approach to logging, utilizing specialized tools at each stage of the data pipeline. By mastering lightweight forwarders like Fluent Bit, robust backends like Elasticsearch and Loki, and powerful visualization tools like Grafana and Kibana, DevOps Engineers can transform raw streams of container output into actionable intelligence. This systematic implementation of centralized logging ensures that application behavior is fully transparent, enabling teams to maintain high availability, optimize performance, and enforce compliance, securing the long-term success of their cloud-native applications in the face of continuous change and complexity.
Frequently Asked Questions
What is the difference between Fluentd and Fluent Bit?
Fluent Bit is a lightweight log collector optimized for low resource usage on every node, while Fluentd is a more powerful aggregator and router used centrally.
Why are logs lost when a Kubernetes container dies?
Logs are typically written to the container's stdout/stderr, which is stored on the ephemeral host filesystem; when the container is terminated, these files are often deleted or overwritten.
What does Loki index, and why is it cost-effective?
Loki indexes only the metadata (labels) associated with the logs, not the full text content, which significantly reduces the storage and indexing costs compared to full-text search engines like Elasticsearch.
What is Structured Logging?
Structured Logging is the practice of emitting logs as machine-readable JSON data rather than raw text strings, which enables efficient parsing, querying, and analysis by logging tools.
What are the three pillars of observability?
The three pillars of observability are logs (event details), metrics (time-series data), and traces (transaction paths), which must be correlated for full system insight.
How does log correlation work in microservices?
Log correlation works by injecting a unique Trace ID into an incoming request and logging that ID in every downstream service, allowing engineers to track the transaction end-to-end.
What is a DaemonSet, and why is it used for log collection?
A DaemonSet is a Kubernetes controller that ensures one instance (Pod) runs on every cluster node, making it the ideal deployment pattern for cluster-wide agents like log collectors and monitoring tools.
How does Grafana unify logs and metrics?
Grafana unifies them by supporting both Loki (logs) and Prometheus (metrics) as data sources, using the same metadata (labels) to correlate and view both data types for the same time frame.
Why are Kubernetes API Audit Logs important?
API Audit Logs track every action performed against the Kubernetes API Server, crucial for security monitoring, forensic analysis, and ensuring compliance with regulatory standards.
What is the benefit of using a commercial tool like Datadog?
The benefit is a fully integrated, low-maintenance solution that automatically correlates logs, metrics, and traces into a single interface with guaranteed SLAs and enhanced features.
What is the role of the Kubelet in logging?
The Kubelet is the agent on the worker node that, among other things, manages the container runtime and ensures container logs are written to the host's filesystem so the log forwarder can collect them.
What is the primary log collector for the Loki stack?
The primary log collector for the Loki stack is Promtail, a lightweight agent deployed as a DaemonSet that reads log streams and pushes them to the Loki server with corresponding Prometheus labels.
How are Linux Admin skills still relevant in Kubernetes logging?
Linux Admin skills are relevant for understanding the host filesystem hierarchy, troubleshooting volume mounts, and diagnosing resource contention, ensuring the collector agent functions correctly.
What is the main advantage of the ELK Stack over cloud-native tools?
The main advantage of the ELK Stack is its open-source flexibility, massive community support, and capability for deep customization and deployment across hybrid or multi-cloud environments.
How does vector improve data integrity in the logging pipeline?
vector improves data integrity by acting as a high-performance, unified data router that offers advanced buffering, robust error handling, and end-to-end reliability for transporting data streams.
What's Your Reaction?
 Like
0
Like
0
 Dislike
0
Dislike
0
 Love
0
Love
0
 Funny
0
Funny
0
 Angry
0
Angry
0
 Sad
0
Sad
0
 Wow
0
Wow
0

![100+ Azure DevOps Interview Questions and Answers [Updated 2025]](https://www.devopstraininginstitute.com/blog/uploads/images/202509/image_140x98_68c40aa9a3834.jpg)


![Future Scope of DevOps Careers in Pune [Updated 2025]](https://www.devopstraininginstitute.com/blog/uploads/images/202510/image_140x98_68e3a84652312.jpg)


