10 DevOps Monitoring Strategies for Zero Downtime
In the hyper-connected landscape of 2026, the cost of a single minute of downtime is higher than ever, making robust monitoring the ultimate safeguard for digital revenue. This expert guide details ten high-impact DevOps monitoring strategies designed to achieve absolute zero downtime, from AIOps-driven predictive alerts and real-time observability to automated self-healing and progressive delivery loops. Learn how to bridge the gap between development and operations by utilizing unified logging, distributed tracing, and automated rollback triggers that respond to anomalies before they affect the end user. Stay ahead of the technical curve and ensure your global infrastructure remains resilient, secure, and always available with these proven monitoring patterns for the modern cloud era.
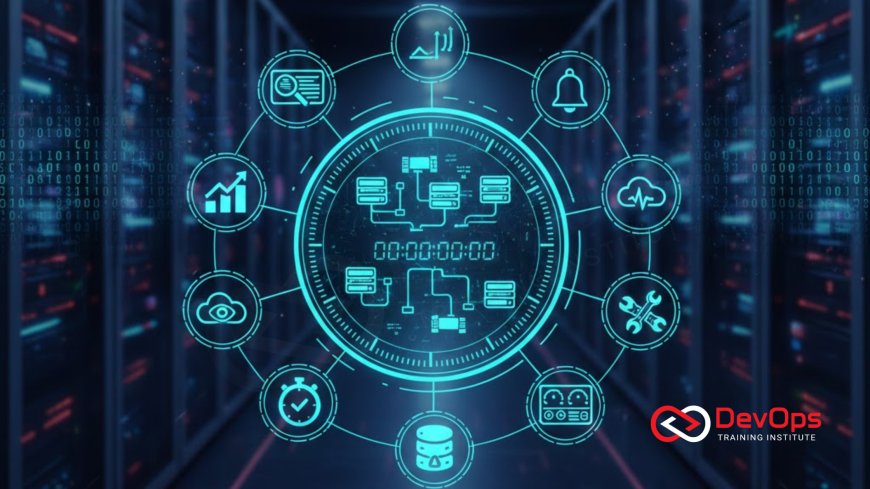
Introduction to Monitoring for Continuous Availability
As we navigate the technical complexities of 2026, the concept of "maintenance windows" is becoming a relic of the past. Modern users expect global services to be available 24/7, and any disruption can lead to immediate revenue loss and long-term brand damage. Achieving zero downtime is no longer just a goal for elite tech giants; it is a standard requirement for any resilient digital business. At the heart of this achievement lies a sophisticated monitoring strategy that does more than just report failures—it predicts and prevents them before they impact the production environment.
Transitioning to zero downtime requires a fundamental shift from traditional monitoring to a more holistic Observability 2.0 approach. This means moving beyond simple uptime checks to understanding the internal state of your system through a unified view of logs, metrics, and traces. By implementing these ten advanced monitoring strategies, DevOps teams can create a proactive safety net that supports rapid innovation while maintaining a rock-solid infrastructure. This guide will walk you through the essential techniques to ensure your software delivery remains invisible, seamless, and always-on for your users worldwide.
Technique One: AIOps and Predictive Anomaly Detection
In a distributed cloud-native environment, the sheer volume of telemetry data makes manual threshold setting nearly impossible. AIOps (Artificial Intelligence for IT Operations) uses machine learning to establish a dynamic baseline for your system's "normal" behavior. Instead of waiting for a CPU spike to trigger an alert, these intelligent systems identify subtle patterns and predictive monitoring signals that indicate an impending failure. This allows your team to intervene hours before a service actually degrades, making it a critical component of any incident handling strategy in 2026.
By integrating AI augmented devops tools, organizations can drastically reduce "alert fatigue" by filtering out noise and focusing on genuine risks. These systems can correlate events across different services, identifying that a small increase in database latency is actually a precursor to a wider application timeout. This proactive stance ensures that your continuous synchronization efforts are always protected by a layer of automated intelligence, allowing your engineers to focus on building features rather than chasing phantom alerts in the middle of the night.
Technique Two: Continuous Verification in the Pipeline
Quality assurance shouldn't stop once a build passes its initial tests. Continuous verification is a strategy where monitoring is integrated directly into the deployment pipeline to validate the health of a new release in real-time. By utilizing continuous verification, teams can automatically compare the performance of a new version against the stable baseline. If the new code shows a 2% increase in error rates or a slight dip in response time, the pipeline can automatically halt the rollout before it touches a significant number of users.
This automated feedback loop is essential for supporting high-frequency release strategies like canary or blue-green deployments. It ensures that every change is not just "functional" but also "performant" and "stable" under production-like conditions. By embedding these checks into your cluster states, you create a self-validating system where only the highest quality code is allowed to progress. This technique reduces the "blast radius" of any potential bug and provides the technical confidence needed to ship code hundreds of times a day with zero risk of service interruption.
Technique Three: Distributed Tracing for Microservices
In a modern microservices architecture, a single user request can hop between dozens of different services, making it difficult to pinpoint exactly where a delay or error is occurring. Distributed tracing allows you to follow the "path" of a request across the entire system, providing a visual map of service interactions. This visibility is vital for maintaining zero downtime because it helps engineers identify hidden bottlenecks and "circular dependencies" that can lead to cascading failures if not addressed immediately.
Implementing tracing across your cloud architecture patterns ensures that your team can achieve a much lower Mean Time to Resolution (MTTR). When a latency spike is detected, tracing reveals whether the issue lies in the networking layer, a specific database query, or a third-party API. By using GitOps to manage your tracing configurations, you ensure that your instrumentation is as consistent and version-controlled as your application code. This transparency is a key differentiator for teams that need to maintain 100% availability in a complex, multi-service environment.
Zero Downtime Monitoring Comparison Table
| Monitoring Strategy | Focus Area | Zero-Downtime Value | Key Tooling |
|---|---|---|---|
| AIOps Anomaly Detection | Predictive Health | Prevents failure before impact | Datadog, Dynatrace |
| Continuous Verification | Deployment Health | Automates go/no-go decisions | Argo Rollouts, Keptn |
| Distributed Tracing | Request Flow | Isolates bottlenecks rapidly | Jaeger, Honeycomb |
| Synthetic Monitoring | User Experience | Validates paths continuously | New Relic, Pingdom |
| Self-Healing Automation | Auto-Remediation | Resolves issues instantly | StackStorm, Kubernetes |
Technique Four: Synthetic Monitoring for User Paths
While backend metrics are important, they don't always reflect the true user experience. Synthetic monitoring involves running automated scripts that simulate real user interactions—such as logging in, adding an item to a cart, or completing a checkout—at regular intervals. This strategy helps detect "silent" failures where the infrastructure appears healthy, but a critical business logic error is preventing users from completing their journey. It is a vital check for maintaining high quality in your release strategies and ensuring that your cluster states are actually serving the business.
Synthetic monitors provide a consistent baseline for availability from multiple geographic locations. If a regional ISP is having trouble connecting to your cluster, you'll know it before your customers start filing tickets. By utilizing ChatOps techniques, these synthetic alerts can be pushed directly to your engineering squad's channel, allowing them to verify and fix the issue instantly. This proactive validation of the user path ensures that your platform is not just "running," but actually "working" for your customers 24/7, maintaining the trust and loyalty that drive long-term business growth.
Technique Five: Real-Time Log Aggregation and Analysis
In a massive, global scale system, logs are often the only way to understand what happened during a transient failure. Real-time log aggregation centralizes data from every container, server, and cloud service into a single searchable index. This allows engineers to perform "cross-stack" correlation, seeing how a security alert in an admission controller might be related to a subsequent application crash. Without centralized logging, debugging a distributed system becomes a slow, manual process of hunting through individual nodes.
Modern log analysis tools use pattern recognition to identify "log spikes" or new error messages that haven't been seen before. This acts as an early warning system for zero-day vulnerabilities or subtle bugs introduced during a recent rollout. By using secret scanning tools within your log pipeline, you can also ensure that no sensitive credentials or PII (Personally Identifiable Information) are accidentally leaked into your logs. This commitment to both visibility and security is a hallmark of a mature DevOps operation that prioritizes the integrity of its deployment quality and user data.
Technique Six: Unified Observability with eBPF
As we move into 2026, eBPF (Extended Berkeley Packet Filter) is becoming the standard for non-intrusive monitoring. This technology allows you to collect deep networking and system metrics directly from the kernel without modifying your application code. This "zero-overhead" observability is perfect for high-performance systems where adding traditional agents might introduce latency or instability. It provides a transparent view of how every pod and service is interacting at the wire level, making it easier to optimize your cloud architecture patterns for maximum speed and resilience.
eBPF-powered tools can automatically map your cluster's network traffic and identify unauthorized connections or security threats in real-time. This level of insight is essential for teams managing containerd runtimes in production, as it allows them to see through the "abstraction layer" of Kubernetes. By utilizing this deep data, DevOps engineers can fine-tune their resource allocation and ensure that their monitoring doesn't become a bottleneck itself. It turns the underlying operating system into a powerful observability engine that supports the entire technical organization's pursuit of zero downtime.
Best Practices for Monitoring Zero Downtime
- Define Clear SLIs and SLOs: Establish Service Level Indicators (metrics) and Objectives (targets) that reflect the true health of the user experience.
- Standardize on OpenTelemetry: Use a vendor-neutral standard for collecting logs, metrics, and traces to avoid lock-in and ensure total visibility across your stack.
- Implement Automated Rollbacks: Configure your continuous synchronization tools to instantly revert changes if key health metrics drop below a safe threshold.
- Harden Your Alerting: Use "cause-based" alerts rather than "symptom-based" ones to reduce noise and help engineers pinpoint the root cause faster.
- Monitor the "Last Mile": Use synthetic monitoring to validate that your global CDN and DNS settings are correctly routing traffic to healthy pods.
- Security as Observability: Use admission controllers to monitor and block insecure pod configurations before they ever reach the production network.
- Continuous Performance Testing: Run load tests in your staging environment that mirror the latest production traffic patterns to find bottlenecks early.
Maintaining a zero downtime environment is an iterative process that requires a strong cultural change within the engineering organization. It's about moving away from "hope-based" deployments to a model of data-driven confidence. By utilizing AI augmented devops, you can automate the mundane parts of monitoring, allowing your human talent to focus on solving complex architectural challenges. The synergy between high-quality data and intelligent automation is what allows the world's most successful companies to ship software faster and more safely than ever before, ensuring their services are always available to the people who need them most.
Conclusion: The Future of Proactive Operations
In conclusion, the ten DevOps monitoring strategies discussed in this guide provide the definitive roadmap for achieving absolute zero downtime in 2026. From the predictive power of AIOps to the deep visibility of eBPF and the safety of continuous verification, these techniques ensure that your infrastructure remains a robust and reliable engine for business growth. The move toward Observability 2.0 marks a new chapter in technical excellence, where the focus is on preventing issues rather than just reacting to them. By prioritizing these strategies today, you are building a future-proof foundation that can handle any scale and any challenge.
As you move forward, remember that who drives cultural change in your team will be just as important as the tools you choose. A shared commitment to transparency, automation, and user-centricity is what truly makes zero downtime possible. Stay informed about the latest release strategies and continue to refine your automated feedback loops. The path to perfection is through continuous learning and relentless optimization. Start by implementing the strategies that address your biggest current pain points and watch your system reliability reach new heights in the global digital landscape.
Frequently Asked Questions
What is the difference between monitoring and observability 2.0?
Monitoring tells you if a system is up, while observability 2.0 explains why it is behaving in a certain way through correlated logs, metrics, and traces.
How does AIOps help in achieving zero downtime?
AIOps uses machine learning to establish dynamic baselines and predict potential system failures before they occur, allowing for proactive remediation by teams.
What is continuous verification in a DevOps pipeline?
It is the process of using real-time monitoring to validate a new deployment's health, enabling automated rollbacks if performance targets are not met.
Why is distributed tracing essential for microservices?
Tracing follows a request's path across different services, making it easy to identify exactly where errors or bottlenecks are happening in a complex system.
What is synthetic monitoring and why is it useful?
Synthetic monitoring uses scripts to simulate real user actions, helping detect failures in critical business paths even when infrastructure metrics look healthy.
How do admission controllers improve deployment quality?
They act as a security gate, automatically blocking the deployment of pods that do not meet your organization's security and configuration standards.
What is the "blast radius" in the context of zero downtime?
The blast radius is the extent of impact a failure has; techniques like canary releases and automated rollbacks aim to keep this radius as small as possible.
Can small teams implement these advanced monitoring strategies?
Yes, many modern cloud-native tools offer these capabilities out of the box, making advanced observability accessible to engineering teams of all sizes.
What role does eBPF play in modern monitoring?
eBPF allows for deep, zero-overhead networking and system monitoring directly from the kernel, without requiring any changes to the application code itself.
How often should I conduct performance testing?
Performance testing should be an ongoing part of your CI/CD pipeline, ideally mirroring production traffic patterns to find issues before every release.
What are SLIs and SLOs?
Service Level Indicators are specific metrics used to measure performance, while Service Level Objectives are the targets set for those metrics to ensure reliability.
How does GitOps help with monitoring?
GitOps ensures that your monitoring and tracing configurations are version-controlled, providing a clear audit trail and consistent setup across all your clusters.
Why is log aggregation important for distributed systems?
It centralizes data from across the stack into a single searchable index, making it much faster to correlate events and find the root cause of failures.
What is "alert fatigue" and how can it be avoided?
Alert fatigue is when engineers are overwhelmed by too many minor alerts; it is avoided by using cause-based, AI-filtered, and prioritized alerting strategies.
What is the first step in starting a zero downtime strategy?
The first step is to establish detailed observability and baseline metrics so you can accurately measure and automate your deployment health and recovery processes.
What's Your Reaction?
 Like
0
 Dislike
0
 Love
0
 Funny
0
 Angry
0
 Sad
0
Sad
0
 Wow
0
Wow
0


![Kong Interview Preparation Guide [2025]](https://www.devopstraininginstitute.com/blog/uploads/images/202509/image_430x256_68dbb95326997.jpg)



![100+ Azure DevOps Interview Questions and Answers [Updated 2025]](https://www.devopstraininginstitute.com/blog/uploads/images/202509/image_140x98_68c40aa9a3834.jpg)


![90+ Git and GitHub Interview Questions [2025]](https://www.devopstraininginstitute.com/blog/uploads/images/202509/image_140x98_68c40a7931d60.jpg)


![Future Scope of DevOps Careers in Pune [Updated 2025]](https://www.devopstraininginstitute.com/blog/uploads/images/202510/image_140x98_68e3a84652312.jpg)


