10 Tools to Measure DevOps Performance Metrics
Discover the top ten essential tools for measuring DevOps performance metrics in 2025. This comprehensive guide explores how leading platforms like Prometheus, Datadog, and Jellyfish help engineering teams track critical DORA metrics, including deployment frequency and mean time to recovery. Learn how to leverage automated data collection and visual dashboards to identify bottlenecks, optimize resource utilization, and drive continuous improvement across your entire software delivery lifecycle today.
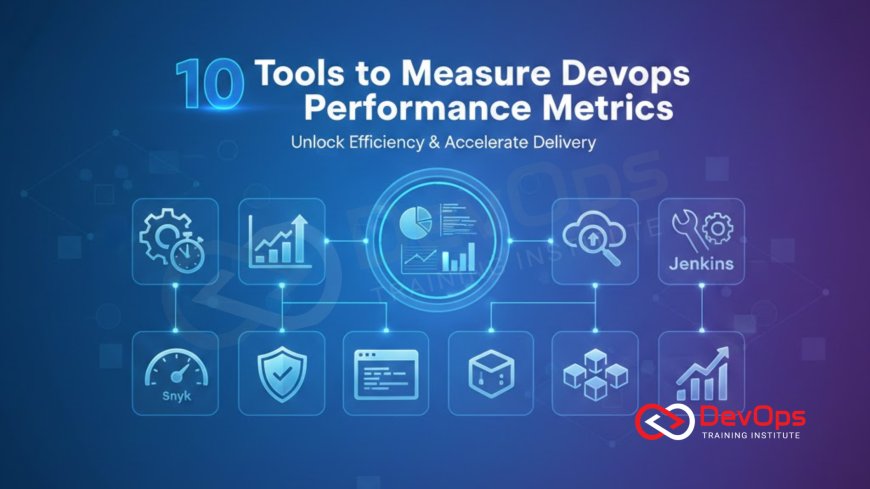
Introduction to DevOps Performance Measurement
In the modern era of rapid software delivery, the old management adage remains truer than ever: you cannot improve what you do not measure. For teams striving to achieve high velocity without sacrificing stability, understanding the data behind their processes is essential. DevOps performance metrics provide the objective visibility needed to transition from gut feeling decision making to evidence based optimization. By tracking specific indicators, organizations can pinpoint exactly where delays occur and which changes lead to the most significant improvements in reliability.
The industry has largely coalesced around the DORA metrics as the gold standard for assessing DevOps maturity. These four key pillars measure speed and stability, providing a balanced view of a team's health. However, simply knowing these metrics is not enough; teams need specialized tools to collect, aggregate, and visualize this data in real time. This blog post explores ten of the most effective tools available today that empower engineering leaders to monitor their performance and foster a culture of excellence throughout the development lifecycle. This foundational data layer is what allows for a successful platform engineering approach in modern organizations.
The Foundation of DORA Metrics
Before diving into the tools, it is vital to understand the framework they are designed to support. The DevOps Research and Assessment (DORA) group identified four metrics that differentiate high performing teams from their peers. These include Deployment Frequency, which tracks how often code is pushed to production, and Lead Time for Changes, which measures the duration from a code commit to a successful deployment. Together, these two metrics represent the speed of a software delivery team.
On the stability side, teams must monitor the Change Failure Rate, which identifies the percentage of deployments that cause a failure in production, and the Mean Time to Recovery (MTTR), which tracks how long it takes to restore service after an incident. Balancing speed with stability is the ultimate goal of DevOps. Without proper measurement, a team might move faster but experience more frequent outages, or maintain high uptime at the cost of being too slow to respond to market changes. Using these metrics ensures a healthy equilibrium between rapid innovation and system safety.
Monitoring and Observability Platforms
Monitoring tools are the primary source of truth for the stability metrics in the DORA framework. These platforms collect raw data from servers, applications, and networks to provide a comprehensive view of system health. By tracking every request and error, these tools can automatically calculate the change failure rate and help engineers identify the exact moment a service degradation began. This level of detail is critical for reducing the time it takes to diagnose and fix complex production issues.
Modern platforms have evolved beyond simple alerting to offer true observability, which allows teams to explore the internal state of their systems through logs, metrics, and traces. When an incident occurs, these tools provide the context needed to understand why it happened, not just that it happened. This deep insight is a prerequisite for effective reliability engineering, as it enables teams to build more resilient systems that can handle the unpredictable nature of cloud native environments and high traffic volumes.
Engineering Intelligence and Productivity Tools
While monitoring tools focus on the runtime environment, engineering intelligence platforms specialize in the human side of the development process. These tools integrate directly with version control systems and project management software to track how work flows from an initial idea to a final release. They provide dashboards that visualize lead times, cycle times, and the overall throughput of an engineering organization, making it easier to identify non technical bottlenecks such as long review cycles or manual testing delays.
These tools are particularly useful for engineering managers who need to balance workloads and ensure that teams are not being burned out by excessive technical debt. By surfacing data on where developers are spending their time, leaders can make informed decisions about when to invest in automation or process improvements. This visibility helps shift the focus from individual performance to team based outcomes, promoting a more collaborative environment where everyone is aligned on the goal of delivering high quality software as efficiently as possible.
Table: Top 10 DevOps Performance Measurement Tools
| Tool Name | Primary Focus | Key Metrics Tracked | Best Use Case |
|---|---|---|---|
| Prometheus | Open-source Monitoring | Uptime, Latency, Error Rates | Cloud-native and Kubernetes setups. |
| Datadog | Full-stack Observability | MTTR, Change Failure Rate | Large enterprise multi-cloud environments. |
| Jellyfish | Engineering Management | DORA Metrics, Cycle Time | Aligning engineering with business goals. |
| Swarmia | Developer Productivity | Lead Time, Investment Balance | Improving daily developer workflows. |
| Grafana | Data Visualization | Custom Performance Dashboards | Unified views of disparate data sources. |
| Sleuth | Deployment Tracking | Deployment Frequency, Impact | Tracking health of every single push. |
| LinearB | Workflow Intelligence | PR Cycle Time, Merge Frequency | Unblocking the code review process. |
| Splunk | Log Analytics | MTTR, Security Incidents | Deep log analysis for reliability. |
| New Relic | Application Performance | Latency, Throughput, Errors | Optimizing user-facing application speed. |
| GitLab DORA | Integrated CI/CD Metrics | Native DORA tracking | Teams using GitLab for the full cycle. |
The Role of Automation in Data Collection
Manual data collection is the enemy of accurate performance measurement. If developers have to manually log their time or update spreadsheets to track deployments, the data will inevitably be delayed or incorrect. The most successful teams leverage automated systems that capture data as a byproduct of their daily work. When a developer merges a pull request or a CI/CD pipeline pushes code to production, the measurement tools should automatically record the event and update the relevant dashboards.
This automated approach is a core part of gitops because it treats the history of the repository as the ultimate source of truth for both the state of the infrastructure and the performance of the team. By removing human intervention from the data collection process, organizations can trust that their metrics are objective and reflect reality. This trust is essential for driving meaningful change, as it allows teams to have honest conversations about where improvements are needed without the distractions of data inaccuracies or personal biases.
Visualizing Performance with Dashboards
Raw data is difficult for humans to interpret quickly, which is why visualization is a critical component of any performance measurement strategy. Dashboards turn complex streams of numbers into intuitive charts and graphs that allow anyone in the organization to see at a glance how the team is performing. Effective dashboards often use color coding to highlight areas that require immediate attention, such as a sharp rise in the change failure rate or a drop in deployment frequency.
Creating shared dashboards also fosters transparency across the organization. When developers, operations engineers, and business leaders all look at the same data, they can align on shared goals more effectively. These visualizations can also be used during retrospectives to celebrate successes and identify specific areas for the next sprint's improvement. High quality visualization tools allow for drilling down into the data, enabling teams to move from high level trends to specific incidents in just a few clicks, which is vital for finding and fixing the root causes of performance regressions.
Security and Reliability in Measurement
Performance measurement should never happen at the expense of security or stability. In fact, a robust measurement strategy should incorporate security indicators to ensure that speed does not lead to vulnerabilities. This integration is a key part of devsecops because it treats security as a fundamental performance metric. Tracking things like the time it takes to patch a critical vulnerability or the percentage of builds that pass security scans provides a more complete picture of a team's effectiveness.
Furthermore, reliability must be tested proactively through techniques like chaos engineering. By intentionally introducing failures and measuring how the system and the team respond, organizations can build higher confidence in their MTTR metrics. This experimental approach ensures that the performance numbers seen on a dashboard are not just a result of luck but are a reflection of a system designed to be resilient. Measuring the impact of these experiments helps teams fine tune their automated response systems and manual playbooks for better real world performance.
Optimizing for Cost and Efficiency
As organizations scale their cloud usage, technical performance metrics must be viewed alongside financial data. High deployment frequency is good, but if it comes at the cost of massive resource waste, it may not be sustainable. This is where finops intersects with DevOps measurement. By tracking the cost per deployment or the resource efficiency of individual microservices, teams can ensure they are delivering value in a cost effective manner.
Some measurement tools now offer integrated cost analysis, allowing engineers to see the financial impact of their infrastructure changes in real time. This visibility encourages a culture of accountability and resourcefulness, where developers are empowered to optimize their code for both speed and cost. Efficient resource usage also contributes to better overall system performance, as it reduces the likelihood of resource contention and unexpected performance throttling in shared cloud environments. This holistic view ensures that the engineering organization remains a value center for the entire business.
Advanced Deployment and Testing Metrics
To truly master DevOps performance, teams must look beyond the standard DORA metrics and into the specifics of their deployment strategies. For instance, measuring the success of canary releases provides granular data on how new code behaves with a small subset of users before a full rollout. This allows teams to catch errors earlier and with less impact than a traditional big bang deployment. Similarly, tracking the usage of feature flags helps measure the decoupling of code deployment from feature release, which is a major factor in improving agility.
Quality metrics are also essential for a complete performance profile. This involves tracking test coverage, defect escape rates, and the effectiveness of automated testing suites. By adopting shift left testing and measuring the results, teams can ensure that they are catching bugs as early as possible in the development cycle. This reduces the overall lead time for changes, as fewer issues are found late in the process when they are much more expensive and time consuming to fix. Combining these advanced metrics with the core DORA indicators creates a comprehensive roadmap for achieving elite performance levels.
Conclusion
In conclusion, the journey to elite DevOps performance is paved with data. By utilizing the ten tools discussed in this blog post, engineering teams can gain the visibility needed to understand their current capabilities and identify clear paths for improvement. Whether it is through the full stack observability of Datadog, the engineering intelligence of Jellyfish, or the integrated DORA tracking of GitLab, each tool offers a unique perspective on the software delivery lifecycle. The key is to start with a focus on the fundamental DORA metrics of speed and stability and then gradually expand into more granular areas like cost optimization, security posture, and advanced deployment strategies. By automating data collection and prioritizing clear visualization, leaders can foster a culture of transparency and continuous learning. Ultimately, DevOps is not a destination but a process of relentless improvement, and having the right measurement tools is the only way to ensure that every step your team takes is a step in the right direction towards higher reliability and faster delivery.
Frequently Asked Questions
What are the four DORA metrics?
The four metrics include deployment frequency, lead time for changes, change failure rate, and mean time to recovery for high performing teams.
Why is deployment frequency important?
It measures how often a team provides value to users and indicates the maturity of their automated deployment and testing processes today.
How does MTTR impact system reliability?
Mean time to recovery measures how fast a team can restore service after a failure, which is critical for maintaining high uptime.
What is a good change failure rate?
Elite performers typically maintain a change failure rate below fifteen percent, ensuring that most deployments are successful without requiring immediate hotfixes.
Can Prometheus track DORA metrics?
Yes, by using specific exporters and PromQL queries, you can track deployment events and system failures to calculate DORA metrics over time.
What is the difference between monitoring and observability?
Monitoring tells you when something is wrong, while observability provides the deep internal data needed to understand why the problem occurred in detail.
How do engineering intelligence tools work?
They connect to tools like Jira and GitHub to automatically analyze metadata about pull requests, commits, and tickets for better performance insights.
What is the benefit of using Grafana?
Grafana provides powerful visualization capabilities, allowing teams to create unified dashboards that combine data from many different monitoring and logging sources easily.
Should I measure performance at the individual level?
No, DevOps metrics should focus on team outcomes and the overall delivery process to encourage collaboration and avoid toxic productivity gaming behaviors.
How does shift-left testing help metrics?
By testing earlier in the process, you reduce lead time for changes and lower the change failure rate by catching bugs before deployment.
What role do feature flags play in performance?
Feature flags allow you to deploy code safely without releasing the feature, reducing deployment risk and improving lead time for code changes.
How can I measure the cost of DevOps?
FinOps practices and tools help track cloud spend per project or team, ensuring that high performance is achieved within a reasonable budget.
What is a canary release?
It is a deployment strategy where a new version of software is rolled out to a small subset of users for testing purposes.
How often should I review my metrics?
Teams should review their performance metrics at least once per sprint or monthly to identify trends and plan for continuous improvement initiatives.
Is manual data collection ever appropriate?
While automation is preferred, manual tracking can be a starting point for small teams before they invest in fully integrated automated measurement platforms.
What's Your Reaction?
 Like
0
 Dislike
0
 Love
0
 Funny
0
 Angry
0
 Sad
0
Sad
0
 Wow
0
Wow
0


![Kong Interview Preparation Guide [2025]](https://www.devopstraininginstitute.com/blog/uploads/images/202509/image_430x256_68dbb95326997.jpg)



![100+ Azure DevOps Interview Questions and Answers [Updated 2025]](https://www.devopstraininginstitute.com/blog/uploads/images/202509/image_140x98_68c40aa9a3834.jpg)


![Future Scope of DevOps Careers in Pune [Updated 2025]](https://www.devopstraininginstitute.com/blog/uploads/images/202510/image_140x98_68e3a84652312.jpg)


