


![Kong Interview Preparation Guide [2025]](https://www.devopstraininginstitute.com/blog/uploads/images/202509/image_430x256_68dbb95326997.jpg)


12 CI/CD Monitoring Tools to Keep Pipelines Healthy
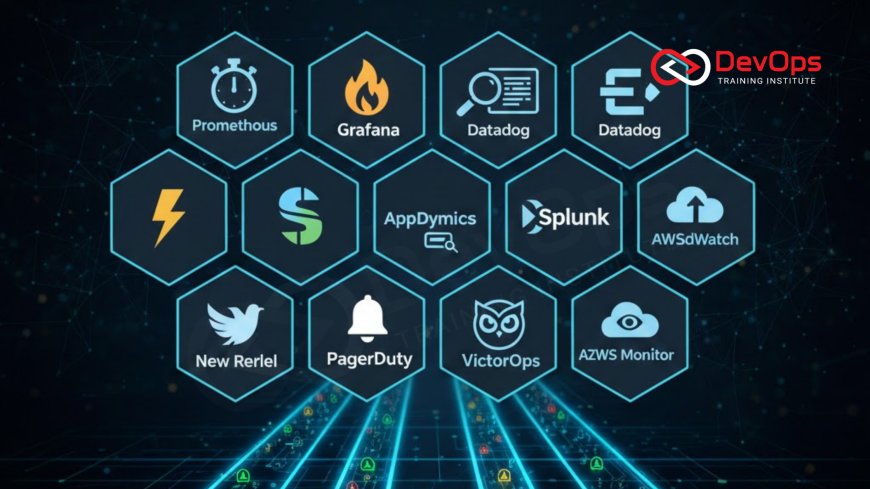
Ensure your software delivery remains flawless by implementing the twelve most powerful CI/CD monitoring tools designed for high-performance DevOps teams in 2026. This extensive guide provides an in-depth analysis of observability platforms like Datadog, Prometheus, and Splunk, helping you maintain healthy pipelines and reduce deployment failures effectively. Learn how to track critical metrics such as build duration, change failure rates, and mean time to recovery with precision. Whether you are managing complex microservices or simple cloud-native applications, these essential tools and best practices will empower your team to gain real-time visibility and build a more resilient technical foundation for your digital growth today.
Introduction to CI/CD Pipeline Observability
In the high-stakes world of modern software engineering, the CI/CD pipeline is the critical highway that delivers value to your users. However, even the most well-architected pipelines can suffer from hidden bottlenecks, silent failures, and performance degradation over time. CI/CD monitoring is the practice of gaining deep visibility into every stage of this delivery process, from the initial code commit to the final production release. By treating your pipeline as a production-grade system, you can identify issues before they impact your developers' productivity or your users' experience in the cloud.
Effective observability goes beyond simple success or failure notifications; it involves tracking the "golden signals" of your delivery engine. This includes monitoring build durations, queue wait times, and the reliability of automated testing suites. As we look toward the technical landscape of 2026, the complexity of distributed systems and microservices requires more sophisticated monitoring solutions that can correlate pipeline events with system health. This guide will introduce you to the top twelve tools that provide the insights necessary to keep your continuous synchronization efforts running smoothly and reliably throughout the entire year.
The Vital Role of Build Performance Metrics
Build performance is one of the most direct indicators of a healthy engineering culture. When build times start to creep up, developer velocity drops, and the feedback loop that is essential for agile development begins to break down. Monitoring tools allow you to visualize these trends over time, helping you pinpoint exactly which stage of the pipeline—whether it is dependency resolution, unit testing, or container image creation—is causing the slowdown. Addressing these bottlenecks ensures that your developers stay in the flow and that your release strategies remain as fast as the business requires.
Furthermore, tracking build performance helps in resource optimization and cost management. By identifying "flaky tests" or inefficient build scripts, you can reduce the compute power required for your CI/CD operations. Many modern platforms use AI augmented devops capabilities to automatically flag anomalies in build duration or resource usage. This proactive approach allows you to maintain a lean and efficient delivery engine, which is a key part of choosing architecture patterns that scale effectively without ballooning your cloud infrastructure bill or causing unnecessary delays in your software updates.
Datadog for End-to-End Pipeline Visibility
Datadog has established itself as a leader in the observability space by providing a unified platform that connects infrastructure metrics with application performance and CI/CD events. Its specialized "CI Visibility" product allows teams to track the health of their pipelines across different providers like Jenkins, GitHub Actions, and GitLab. By correlating pipeline failures with underlying infrastructure issues, Datadog helps engineers quickly determine if a build failed because of a code bug or a resource constraint in the build environment. It is an essential tool for maintaining high cluster states health.
The platform provides out-of-the-box dashboards that visualize the "Four Keys" of DevOps metrics: deployment frequency, lead time for changes, change failure rate, and mean time to recovery. This data is invaluable for engineering leaders who need to measure the effectiveness of their cultural change initiatives and identify areas for process improvement. With its powerful alerting system, Datadog can notify the team through various channels the moment a critical pipeline regresses, ensuring that incident handling begins immediately. Its deep integration with secret scanning tools also adds a layer of security monitoring directly into the observability flow.
Prometheus and Grafana: The Open Source Standard
For teams that prefer a self-hosted and highly customizable solution, the combination of Prometheus and Grafana remains the industry standard. Prometheus acts as the powerful time-series database that scrapes metrics from your CI/CD runners and the Kubernetes API, while Grafana provides the visualization layer. This duo is particularly effective for monitoring containerized build environments where resources are dynamic and ephemeral. By using specialized exporters, you can track everything from the CPU usage of a specific Jenkins agent to the network latency of your internal artifact repository.
The flexibility of Grafana allows you to build highly specialized dashboards that cater to the unique needs of your DevOps team. You can create views that combine pipeline status with continuous verification results and production health metrics. This "single pane of glass" approach is vital for understanding the impact of a deployment on the overall system. Since both tools are open-source, they are a cost-effective choice for organizations that want deep visibility without the high seat costs of commercial SaaS platforms. They are a cornerstone for teams committed to the principles of GitOps and infrastructure as code transparency.
Comparison of Leading CI/CD Monitoring Tools
| Tool Name | Primary Focus | Best Integration | Observability Level |
|---|---|---|---|
| Datadog | Full-Stack Observability | Multi-CI Support | Very High |
| Prometheus | Metrics Collection | Kubernetes / Docker | High |
| Splunk | Log Analytics | Enterprise Legacy | High |
| New Relic | APM & Change Tracking | Cloud-Native Apps | Medium |
| Harness | Pipeline Governance | CD Automation | Medium |
Leveraging Splunk for Deep Log Analysis
In many enterprise environments, the CI/CD pipeline generates massive amounts of log data that can be difficult to parse during a troubleshooting session. Splunk excels at indexing and analyzing these large datasets, providing powerful search capabilities that allow engineers to find the root cause of a complex failure across multiple services. By creating custom dashboards in Splunk, you can monitor for specific error patterns in your build logs or track the frequency of failed secret scanning tools alerts. This level of detail is essential for organizations with strict compliance and security requirements.
Splunk’s "Observability Cloud" also incorporates real-time monitoring and alerting, making it a comprehensive solution for large-scale operations. It can ingest data from almost any source, allowing you to correlate CI/CD events with data from your network, database, and end-user applications. This global view is critical for understanding the "ripple effect" of a deployment failure. While it can be more expensive than other options, its ability to provide continuous synchronization insights across legacy and modern systems makes it a favorite for Fortune 500 companies undergoing complex digital transformations in 2026. It ensures that no detail is lost in the noise of a busy pipeline.
New Relic and the Power of Change Tracking
New Relic has long been a favorite for Application Performance Monitoring (APM), but its newer "Change Tracking" features make it a strong contender for CI/CD monitoring. This functionality allows you to mark exactly when a deployment occurred within your performance graphs. When an error spike or a latency increase happens, you can immediately see which deployment caused it. This correlation is a core part of modern ChatOps techniques, as it provides the team with instant context during a production incident and speeds up the decision to roll back.
The platform also offers specialized integrations for Kubernetes that provide visibility into the health of your containerd runtimes and orchestration layer. By monitoring the resources used by your CI runners, New Relic helps you identify when your pipeline is under-provisioned, which often leads to flaky builds and frustrated developers. Its AI-powered "NerdGraph" allows you to query your data in natural language, making it easier for non-technical stakeholders to understand the status of your release strategies. This democratized access to data helps align the entire business around the common goal of stable and frequent software delivery.
Top 12 CI/CD Monitoring Tools for Pipeline Health
- Datadog: A comprehensive SaaS platform for correlating CI/CD events with full-stack observability and security logs.
- Prometheus: The leading open-source time-series database for collecting and alerting on technical metrics from build runners.
- Grafana: An essential visualization tool that creates interactive and beautiful dashboards for monitoring your entire delivery engine.
- Splunk: A powerhouse for log aggregation and deep forensic analysis of pipeline failures in complex enterprise environments.
- New Relic: Excellent for tracking the impact of deployments on application performance through integrated change tracking and APM.
- Elastic Stack (ELK): A versatile toolset for search, analysis, and visualization of log data that is highly popular in open-source circles.
- Harness: Focuses on continuous delivery governance, providing automated health checks and verification for every single deployment.
- AppDynamics: Provides deep business-centric monitoring that helps connect pipeline performance with actual user experience and revenue.
- Dynatrace: Uses advanced AI to automatically discover and monitor your entire CI/CD ecosystem without manual configuration or scripts.
- Thundra: A specialized tool for monitoring serverless pipelines and microservices, providing deep tracing for distributed workflows.
- Instana: Offers automated monitoring for dynamic applications and the pipelines that deliver them, with a focus on ease of use.
- PagerDuty: While primarily for incident response, its integrations are vital for managing alerts generated by your CI/CD monitoring tools.
Selecting the right tool depends on your team's specific technical stack and the level of granularity required for your operations. Most successful DevOps teams use a combination of these tools—for example, pairing Prometheus for real-time technical metrics with Datadog for high-level business dashboards. The key is to ensure that your monitoring setup is as automated as your pipeline itself. By utilizing admission controllers and policy-as-code, you can ensure that every new service launched is automatically registered with your monitoring platform, maintaining 100% visibility at all times.
Conclusion on Healthy Pipeline Monitoring
In conclusion, keeping your CI/CD pipelines healthy is an ongoing commitment that requires the right set of observability tools. From the deep log analysis of Splunk to the real-time metrics of Prometheus and the end-to-end visibility of Datadog, these twelve tools provide the foundation for a resilient delivery process. By monitoring your golden signals and correlating pipeline events with system health, you can reduce downtime, improve developer velocity, and deliver higher quality software. The shift toward more AI augmented devops capabilities in 2026 will further enhance these tools, making it easier than ever to predict and prevent failures before they occur.
As you move forward, consider how continuous verification can act as the ultimate quality gate in your monitoring strategy. By integrating real-time feedback into your automated workflows, you ensure that every change meets the highest standards of performance and security. Whether you are managing AI augmented devops trends or refining your release strategies, your monitoring tools are your most valuable allies. Invest in the right observability foundation today to build a faster, safer, and more predictable future for your organization’s software engineering department.
Frequently Asked Questions
What are the "Golden Signals" of a CI/CD pipeline?
The golden signals include build duration, failure rate, wait time in queue, and the overall time to recover from a failure.
Why is log aggregation important for CI/CD pipelines?
Log aggregation centralizes data from various sources, making it much easier to search for error patterns and debug complex multi-stage pipeline failures.
Can I use Prometheus to monitor Jenkins?
Yes, by using the Prometheus plugin for Jenkins, you can export dozens of build and runner metrics directly into your monitoring stack.
What is the difference between monitoring and observability?
Monitoring tells you when something is wrong, while observability allows you to understand why it is wrong by analyzing internal system data.
How does change tracking help in DevOps?
Change tracking marks exactly when a deployment occurred, allowing engineers to correlate new errors with specific code changes or configuration updates.
Are SaaS monitoring tools better than open-source ones?
SaaS tools offer faster setup and less maintenance, while open-source tools provide more customization and no licensing costs for larger technical teams.
What role does AI play in CI/CD monitoring?
AI can automatically detect anomalies, predict potential pipeline failures, and suggest root cause fixes based on historical data patterns and system behavior.
How often should I review my pipeline monitoring dashboards?
Dashboards should be reviewed daily by the DevOps team, and automated alerts should be set to notify engineers of critical issues immediately.
Does monitoring impact the performance of my builds?
Most modern monitoring tools are designed to have minimal overhead, but it is important to choose efficient exporters and agents for your runners.
What is the "Four Keys" of DevOps metrics?
They are deployment frequency, lead time for changes, change failure rate, and mean time to recovery, used to measure organizational engineering performance.
Can I monitor secret leakage through my CI/CD tools?
Yes, integrating secret scanning tools into your pipeline allows you to monitor for accidental exposure of credentials and block insecure deployments automatically.
Is Splunk too expensive for a small startup?
Splunk can be expensive for small teams, but they offer free tiers and specialized versions that might fit smaller data ingestion requirements initially.
How does a service mesh help in pipeline monitoring?
A service mesh provides deep visibility into internal service communication, helping monitor the networking aspect of complex microservices-based delivery and integration workflows.
What is the benefit of a "single pane of glass" dashboard?
It allows the team to see all critical data in one place, reducing the need to switch between different tools during an incident.
What is the first tool I should implement for monitoring?
Start with a basic metrics collector like Prometheus or a built-in CI dashboard to track build success rates and durations before scaling up.
What's Your Reaction?
 Like
0
Like
0
 Dislike
0
Dislike
0
 Love
0
Love
0
 Funny
0
Funny
0
 Angry
0
Angry
0
 Sad
0
Sad
0
 Wow
0
Wow
0
![100+ Azure DevOps Interview Questions and Answers [Updated 2025]](https://www.devopstraininginstitute.com/blog/uploads/images/202509/image_140x98_68c40aa9a3834.jpg)


![Future Scope of DevOps Careers in Pune [Updated 2025]](https://www.devopstraininginstitute.com/blog/uploads/images/202510/image_140x98_68e3a84652312.jpg)


