


![Kong Interview Preparation Guide [2025]](https://www.devopstraininginstitute.com/blog/uploads/images/202509/image_430x256_68dbb95326997.jpg)


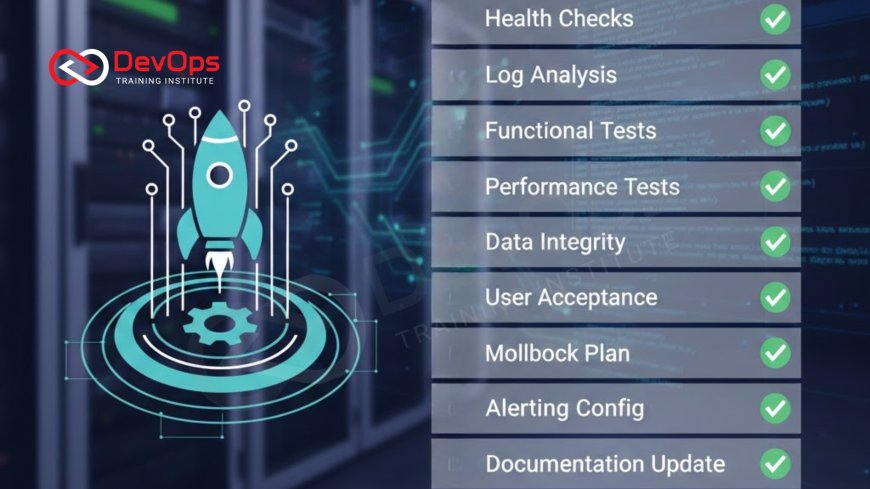
12 Post-Deployment Validation Steps in CI/CD
Discover the essential twelve post-deployment validation steps in CI/CD pipelines to ensure your software releases are stable and secure. This guide covers critical procedures including smoke testing, health checks, performance monitoring, and security auditing. Learn how to implement robust validation strategies that reduce downtime, protect user experience, and foster a culture of high-quality software delivery within modern DevOps and site reliability engineering frameworks for your organization today.
Introduction to Post-Deployment Validation
The moment a new piece of code reaches the production environment is often the most stressful part of the software development lifecycle. While many teams focus heavily on pre-deployment testing, what happens immediately after the code goes live is just as critical. Post-deployment validation is the process of verifying that the application is running as expected in its final destination. This phase ensures that the transition from a staging environment to a live setting has not introduced any unforeseen issues that could impact end users.
In a modern continuous integration and delivery pipeline, validation must be automated, fast, and comprehensive. It serves as the final safety net, allowing teams to detect failures early and trigger rollbacks if necessary. By following a structured approach to post-release verification, organizations can maintain high availability and deliver a consistent user experience. This blog will explore the twelve vital steps that help engineers confirm the health and integrity of their deployments, moving beyond simple hope and toward data-driven confidence in every release.
Automated Health Checks and Smoke Testing
The very first step after the deployment scripts finish running is to perform basic health checks. These are simple automated tests that ping specific endpoints to ensure the application is up and the server is responding correctly. A smoke test goes a layer deeper by exercising the most critical functions of the application, such as the login page or the checkout process. If these fundamental parts are broken, the deployment is considered a failure, and immediate action is required to prevent wider impact.
Implementing these checks allows the system to be self-aware. When combined with gitops, the infrastructure can automatically reconcile its state based on the results of these tests. Automated health checks reduce the need for manual verification and provide instant feedback to the engineering team. This immediate visibility is essential for high-velocity teams that release code multiple times a day, ensuring that no broken version stays live longer than a few seconds before being detected and addressed by the automation layers.
Synthetic Monitoring and User Journey Simulation
Synthetic monitoring involves using scripts to simulate real user interactions with your application from various locations around the world. These "robots" walk through common user journeys, such as searching for a product or updating a profile, to ensure that the entire system is functioning correctly across different browsers and devices. This type of validation is proactive because it identifies issues before actual customers encounter them, providing a layer of protection for the brand's reputation.
By simulating user behavior, teams can detect latent issues like slow page loads or broken third-party integrations that might not show up in traditional server-side monitoring. This step is a vital part of platform engineering as it helps maintain a consistent service level across global clusters. Synthetic tests provide a baseline for performance, allowing engineers to see exactly how a new deployment affects the user experience under realistic conditions. This data is invaluable for making informed decisions about whether to keep a release live or revert to a previous version.
Infrastructure and Configuration Validation
Sometimes the application code is perfect, but the environment it runs in is misconfigured. Post-deployment validation must include checks for infrastructure health, such as verifying that environment variables are set correctly, database connections are active, and security groups are allowing the right traffic. In complex cloud-native systems, a simple typo in a configuration file can lead to massive outages that are difficult to diagnose if you are only looking at application logs.
Using automated scripts to validate the state of the infrastructure ensures that every component is aligned with the intended design. This practice is closely linked to devsecops because it ensures that security guardrails remain in place after every update. By verifying that the underlying servers, load balancers, and storage systems are healthy, teams can rule out environmental factors when troubleshooting. This holistic view of the deployment helps build a more resilient system where the relationship between code and infrastructure is constantly verified and secured.
Table: Summary of Validation Steps
| Validation Step | Primary Goal | Automation Level | Timeframe |
|---|---|---|---|
| Health Checks | Verify service is reachable | Fully Automated | Immediate (0-2 mins) |
| Smoke Testing | Check core functionality | Automated | Early (2-10 mins) |
| Log Analysis | Identify error spikes | Automated/AI-driven | Continuous |
| Canary Analysis | Compare new vs old version | Semi-Automated | During Rollout |
| Security Audit | Scan for vulnerabilities | Automated | Post-Release |
Real-Time Log Analysis and Error Tracking
Once traffic begins to hit the new deployment, the application logs become the most important source of information. Automated log analysis tools scan for spikes in error codes like 500 or 404, which often indicate a bug in the new code. Error tracking platforms also group these errors by their root cause, allowing developers to see if a specific database query is failing or if a certain user group is experiencing issues. This real-time visibility is vital for a quick response.
Effective log management is a key differentiator when discussing observability in modern software environments. By analyzing logs in real-time, teams can identify subtle issues that automated tests might have missed. This constant stream of data provides a deep understanding of application health and helps in performing rapid root cause analysis. When log analysis is integrated into the CI/CD pipeline, it can even trigger automated rollbacks if the error rate exceeds a certain threshold, protecting the production environment from prolonged instability.
Canary Analysis and Progressive Rollouts
Instead of releasing code to all users at once, many teams use a canary deployment strategy. This involves sending a small percentage of traffic to the new version and comparing its performance against the stable old version. If the "canary" version shows higher latency or more errors, the rollout is stopped immediately. This gradual approach minimizes the risk of a widespread outage and allows for validation under real production load with minimal impact on the broader user base.
Learning how do canary releases reduce risk in production deployments is essential for any DevOps professional. This technique allows for a highly controlled validation process where data from actual users drives the rollout decision. It combines automated metrics with real-world feedback, ensuring that only healthy code reaches the majority of users. Progressive delivery transforms deployment from a high-stakes event into a series of small, validated steps that prioritize system stability and user trust above all else.
Performance Monitoring and Latency Checks
A deployment might be functional but still be a failure if it makes the application significantly slower. Post-deployment validation must include performance monitoring to check for increases in response times or resource usage. If the new version consumes twice as much CPU or takes an extra second to load a page, it can lead to higher costs and a poor user experience. Latency checks help ensure that the system remains performant and within its defined service level objectives.
Integrating cost-aware monitoring is also a growing part of finops practices, as it helps teams see the financial impact of their architectural changes. By monitoring performance metrics immediately after deployment, engineers can identify memory leaks or inefficient code paths that were not apparent in lower environments. This data-driven approach allows for fine-tuning the application to ensure it runs as efficiently as possible, maximizing both performance and cost-effectiveness in a competitive digital landscape.
Security Scanning and Compliance Verification
Security validation does not end when the code is deployed; it is an ongoing process. Automated security scans should run against the live production environment to check for open ports, outdated libraries, or misconfigured access controls. This step ensures that the deployment has not introduced any vulnerabilities that could be exploited by attackers. Compliance verification is also crucial for organizations in regulated industries, ensuring that every update meets necessary legal and security standards.
By automating these security audits, teams can maintain a high security posture without slowing down their delivery speed. This continuous verification helps in identifying threats that only manifest in a live, internet-facing environment. It provides peace of mind that the application is not only functional and fast but also safe for users to interact with. Security scanning as a post-deployment step creates a closed loop where every release is scrutinized for safety, making security a shared responsibility across the entire engineering organization.
Conclusion
The success of a CI/CD pipeline is not just measured by how fast code reaches production, but by how reliably it stays there. The twelve post-deployment validation steps we have discussed provide a comprehensive framework for ensuring that every release is a positive step forward. From the immediate feedback of health checks and smoke testing to the deep insights provided by log analysis and canary rollouts, these steps create a robust safety net. By validating both the application code and the underlying infrastructure, teams can minimize downtime and protect the user experience. Furthermore, integrating performance monitoring and security scanning ensures that the system remains efficient and secure over the long term. Embracing these validation strategies fosters a culture of operational excellence and high-quality delivery. As applications continue to grow in complexity, the ability to automatically verify deployments will remain a defining factor in technical and business success. By implementing these rigorous checks, you are effectively future-proofing your delivery process and building a foundation of trust with your users that can withstand the unpredictable challenges of a digital world.
Frequently Asked Questions
What is post-deployment validation?
It is the process of verifying that an application is healthy and functioning correctly immediately after it has been deployed to production.
Why are health checks important?
Health checks provide an immediate signal that the service is running and reachable, preventing users from facing dead links or broken pages.
What is a smoke test?
A smoke test is a quick set of automated tests that exercise the most critical features of an application to ensure basic stability.
How does canary analysis work?
It routes a small amount of traffic to the new version and compares its performance against the old version before a full rollout.
Can I automate all validation steps?
Most validation steps can be fully automated using monitoring tools, testing scripts, and CI/CD platform integrations for high efficiency.
What is synthetic monitoring?
Synthetic monitoring uses automated scripts to simulate user actions and monitor application behavior from the perspective of an end user.
How do logs help after deployment?
Logs provide detailed information about application errors and system behavior, allowing for rapid troubleshooting of any issues that occur post-release.
What is the benefit of a blue-green deployment?
A blue-green deployment allows for near-instant rollbacks by keeping the old stable environment active while the new one is validated.
Does performance monitoring save money?
Yes, by identifying resource-heavy code early, teams can optimize their cloud usage and reduce overall infrastructure costs effectively.
What role do feature flags play in validation?
Using feature flags allows teams to deploy code but enable features gradually, providing an extra layer of safety and control.
How does chaos engineering relate to validation?
Practicing chaos engineering helps verify that your validation triggers and self-healing mechanisms actually work during a real system failure.
Why is security scanning a post-deploy step?
It checks for live configuration vulnerabilities and internet-facing threats that might not be visible in a protected staging environment.
What is the 'Shift Left' strategy?
The shift left testing approach moves quality checks earlier in the process to prevent bugs from ever reaching the deployment stage.
How long should validation take?
Initial validation should take minutes, while deeper monitoring and canary analysis can continue for several hours during the rollout phase.
What happens if validation fails?
If a failure is detected, the CI/CD pipeline should automatically halt the release and trigger a rollback to the last known stable version.
What's Your Reaction?
 Like
0
Like
0
 Dislike
0
Dislike
0
 Love
0
Love
0
 Funny
0
Funny
0
 Angry
0
Angry
0
 Sad
0
Sad
0
 Wow
0
Wow
0

![100+ Azure DevOps Interview Questions and Answers [Updated 2025]](https://www.devopstraininginstitute.com/blog/uploads/images/202509/image_140x98_68c40aa9a3834.jpg)


![Future Scope of DevOps Careers in Pune [Updated 2025]](https://www.devopstraininginstitute.com/blog/uploads/images/202510/image_140x98_68e3a84652312.jpg)


