


![Kong Interview Preparation Guide [2025]](https://www.devopstraininginstitute.com/blog/uploads/images/202509/image_430x256_68dbb95326997.jpg)


14 Observability Tools Beyond Monitoring
Explore 14 cutting-edge observability tools that go far beyond traditional monitoring to provide deep, actionable insights into cloud-native and distributed systems. This guide covers essential platforms for collecting, correlating, and analyzing the three pillars of observability—metrics, logs, and traces—including unified platforms, specialized tracing solutions, and open-source standards. Learn how tools like OpenTelemetry, Grafana Tempo, and distributed tracing systems enable rapid root cause analysis, chaos engineering, and proactive incident detection, transforming your operational strategy from reactive alerting to intelligent, integrated system understanding, which is critical for modern DevOps success.
Introduction
In the age of cloud-native architecture, traditional monitoring—which answers the question "Is the system up?"—is no longer enough. Modern distributed systems, composed of ephemeral containers, microservices, and serverless functions, require observability. Observability is the capacity to ask arbitrary questions about the system's internal state from its external outputs (metrics, logs, and traces) and understand why a service is behaving in a certain way. It allows engineers to diagnose novel, unforeseen failures without needing to deploy new debugging code. This proactive, comprehensive approach is vital for managing the complexity inherent in a fast-paced DevOps environment where changes are constant and service dependencies are intricate.
The foundation of observability rests on the "three pillars": Metrics (time-series data for trending and alerting), Logs (discrete, structured events for forensic detail), and Traces (end-to-end request flow for causality and latency). While traditional monitoring often relies solely on basic host metrics and simple logs, true observability requires tools that can seamlessly collect, correlate, and analyze all three types of data across service boundaries. The right toolchain is essential for transforming raw telemetry into actionable intelligence, enabling rapid root cause analysis (RCA) and reducing Mean Time to Resolution (MTTR).
This guide presents 14 essential tools and platforms that define the modern observability landscape, going far beyond basic CPU and memory monitoring. We will cover solutions that specialize in each of the three pillars, as well as unified platforms that bring them all together. Adopting these tools ensures your engineering team is equipped to handle the complexity of microservices and maintain a high-velocity release cadence while preserving high reliability. By investing in these technologies, you move your operations from reactive fire-fighting to proactive, data-driven system understanding, a cornerstone of operational maturity.
Pillar I: Metrics and Time-Series Analysis
Metrics provide the numerical foundation for observability, answering the "what" and "when" of a service issue. The key to powerful metric analysis is not just collection, but the ability to query, alert, and store large volumes of high-dimensional data efficiently, allowing for granular analysis of system performance over time. These tools are the foundation for defining and measuring Service Level Indicators (SLIs) and Service Level Objectives (SLOs).
1. Prometheus
Prometheus is the de facto open-source standard for metrics collection in cloud-native environments. It uses a pull-based model to scrape metrics endpoints from instrumented services and stores them in a highly scalable time-series database. Its powerful query language, PromQL, enables complex, real-time aggregation and alerting. Prometheus is non-negotiable for monitoring Kubernetes and microservices, as its service discovery features integrate seamlessly with container orchestration.
2. Grafana
Grafana is the visualization layer that complements Prometheus (and many other data sources). It provides customizable, interactive dashboards to visualize metrics, logs, and traces in a unified interface. Grafana allows engineers to easily create complex dashboards, define alert notifications, and explore data trends, making the vast amount of telemetry data comprehensible and actionable for both technical and non-technical stakeholders.
3. Cortex / Thanos
Cortex and Thanos are open-source projects designed to solve Prometheus's main limitations: long-term storage and global visibility across multiple clusters. Cortex offers horizontally scalable, multi-tenant, and highly available long-term storage for Prometheus. Thanos achieves the same goals by enabling seamless querying across multiple Prometheus instances and providing highly scalable archival storage in the cloud, consolidating all metric data into a unified global view. These tools are essential for enterprise-scale deployments that require historical data analysis and centralized operational visibility.
Pillar II: Distributed Tracing and Causality
Distributed tracing is perhaps the most powerful aspect of modern observability, answering the crucial questions of "where" and "why" performance issues or errors occur in microservices. Tracing reconstructs the path of a single request across all services, databases, and network calls, identifying latency bottlenecks and logical failure points. Traces are indispensable for rapidly diagnosing issues that span multiple service boundaries, reducing investigation time from hours to minutes.
4. Jaeger
Jaeger is an open-source, end-to-end distributed tracing system released by Uber and now a graduated CNCF project. It is used for monitoring and troubleshooting complex transactions in distributed systems. Jaeger provides a UI for visualizing trace paths, analyzing latency, and querying traces by tags and services, enabling rapid diagnosis of distributed application performance problems. It natively supports the OpenTracing/OpenTelemetry standards.
5. Zipkin
Zipkin is another popular open-source distributed tracing system, originating from Twitter. It collects timing data needed to troubleshoot latency problems in microservice architectures and provides a comprehensive dashboard for viewing traces. Like Jaeger, Zipkin's strength lies in providing the causality map of a request, helping engineers quickly pinpoint the exact span (service call) responsible for a performance or error bottleneck across the entire system. Understanding these traces is often the fastest path to incident resolution, supporting the finding on which observability pillar gives the fastest incident insight.
6. Grafana Tempo
Grafana Tempo is a high-volume, cost-effective distributed tracing backend designed for massive scale. It is highly integrated with Prometheus and Loki (Grafana's logging solution), allowing for seamless navigation between metrics, logs, and traces using shared correlation IDs. Tempo stores trace data efficiently in object storage (S3, GCS), making it highly scalable and cost-efficient for storing the vast amount of data generated by modern microservices, making it a powerful, unified component of the Grafana ecosystem.
Pillar III: Logs and Contextual Data
Logs provide the forensic details and discrete event context that metrics and traces often lack. For logs to be effective in an observable system, they must be structured (e.g., JSON format), centralized, and easily searchable. These tools focus on efficient log collection, high-volume storage, and powerful querying capabilities, turning unstructured text into valuable, searchable data points that are critical for debugging and security auditing.
7. Loki
Loki is a log aggregation system from Grafana Labs, designed to be cost-effective and highly scalable. Unlike traditional log aggregators that index the full text of logs, Loki focuses on indexing only metadata (labels) associated with logs. This unique design makes it faster and more cost-effective for storage and querying large volumes of log data, particularly when correlating with Prometheus metrics using shared labels. Loki's efficiency and integration with Grafana make it a modern choice for log management, aligning perfectly with RHEL 10 log management best practices for centralized auditing.
8. Fluentd / Fluent Bit
Fluentd (and its lightweight counterpart, Fluent Bit) is a popular open-source data collector for unified logging. These tools collect log data from various sources (applications, containers, hosts, system logs) and process them by tagging, parsing, and routing them to different destinations (e.g., Elasticsearch, Loki, Kafka). Fluent Bit is often preferred for containerized environments due to its small memory footprint, acting as the crucial collection agent on every host and ensuring logs are correctly structured and delivered to the central analysis platform.
9. Elasticsearch / OpenSearch
Elasticsearch (often paired with Fluentd/Logstash and Kibana, forming the ELK stack) remains a dominant choice for log storage and analysis. It provides powerful full-text search, high scalability, and near real-time indexing capabilities. OpenSearch is the community-driven, open-source fork of Elasticsearch, offering similar functionality with strong enterprise support. These tools are indispensable for deep log forensics, security auditing, and generating aggregated metrics from log data, enabling complex, text-based queries that are crucial during incident investigation.
Pillar IV: Unified Platforms and Advanced Practices
The most advanced observability stacks focus on unifying the three pillars into a cohesive whole and leveraging that data for proactive, intelligent system management. These tools abstract away the complexity of managing separate data stores and introduce advanced capabilities like continuous profiling, AIOps, and built-in chaos testing, moving the focus from just gathering data to actively managing service reliability and security.
10. OpenTelemetry (Unification Standard)
OpenTelemetry (OTel) is a fundamental, vendor-neutral standard for observability. It provides the APIs, SDKs, and tools necessary to instrument applications to produce high-quality metrics, logs, and traces uniformly, regardless of the language or framework used. OTel eliminates vendor lock-in and is essential for future-proofing your observability strategy, ensuring that all services emit correlatable telemetry data that can be routed to any backend analysis tool.
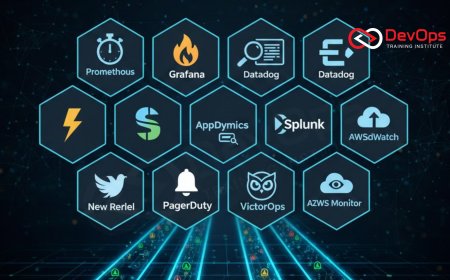
11. Dynatrace / New Relic / Datadog (Commercial APM)
Commercial Application Performance Monitoring (APM) tools like Dynatrace, New Relic, and Datadog offer highly integrated, proprietary platforms that automatically collect and correlate metrics, logs, and traces with advanced AI-driven root cause analysis. These platforms often excel at providing immediate, deep code-level insights, synthetic monitoring, and user experience analytics, offering an all-in-one solution for large enterprises willing to invest in proprietary technology for full-stack visibility, often leveraging AIOps to reduce alert fatigue and speed up incident resolution.
12. Chaos Mesh / Litmus Chaos
While not strictly observability tools, Chaos Mesh and Litmus Chaos are essential complements. They allow engineers to run controlled chaos experiments (e.g., latency injection, pod failure, resource exhaustion) against their applications. Observability tools are then used to measure the system's resilience and understand how it fails, validating the effectiveness of resilience patterns like circuit breakers and retries. This proactive testing aligns perfectly with the goal of improving reliability and ensures that the system behaves as expected under turbulent conditions. This integrated approach elevates simple monitoring to proactive system validation.
13. Service Mesh Observability (Istio / Linkerd)
A service mesh (e.g., Istio, Linkerd) automatically generates rich observability data (metrics, logs, and traces) for all service-to-service communication without requiring any application code changes. This out-of-the-box telemetry, generated by the sidecar proxies, provides crucial insights into network performance, security, and traffic routing across the microservices layer. Service mesh data is particularly valuable for understanding the network behavior and policy enforcement within complex distributed applications, significantly simplifying microservices deployment analysis.
14. Continuous Profiling Tools (Parca, Pyroscope)
Continuous Profiling tools provide insights into application code execution, showing exactly where CPU time, memory, and I/O are spent over time. Unlike traditional profiling run on demand, continuous profiling is always running, providing a constant stream of low-overhead performance data. When correlated with metrics and traces, profiling data can pinpoint the exact lines of code responsible for latency spikes or resource hogs, which is the deepest level of observability possible and is crucial for optimizing code performance and resource efficiency.
Conclusion
The operational success of any cloud-native platform is contingent upon its observability strategy. The 14 tools detailed here demonstrate that modern observability goes far beyond simply setting up health checks; it requires a sophisticated, integrated toolchain that can handle the volume, velocity, and complexity of metrics, logs, and traces generated by distributed systems. By adopting tools like Prometheus for metrics, Jaeger/Tempo for tracing, and Loki/Elasticsearch for logs, and by standardizing instrumentation with OpenTelemetry, organizations can achieve a unified view of system health and causality across the entire application stack.
The true power of this observability stack is realized when the three pillars are seamlessly correlated, enabling engineers to jump from a metric alert to the specific trace that caused the anomaly, and finally to the relevant log line for forensic detail. Furthermore, the integration of advanced practices, such as chaos engineering and continuous profiling, ensures that observability is used proactively to find and fix issues before they impact the end-user. This commitment to data-driven operational intelligence is what allows elite DevOps teams to maintain a rapid release cadence while preserving high service reliability, turning potential incidents into rapid, data-driven learning opportunities.
For any engineer managing cloud-native infrastructure, mastery of these 14 tools is essential. They are the keys to understanding and managing the complexity of the modern software world. By making observability a foundational requirement of your DevSecOps pipeline and continually refining your toolchain, you move your operations toward a state of predictable, resilient, and highly efficient system management. This systematic investment is what guarantees the stability and performance needed for continuous innovation and excellence in the competitive technology landscape, ensuring that your provisioned infrastructure (perhaps managed by IaC) adheres to all necessary security controls and operates optimally.
Frequently Asked Questions
What is the primary function of OpenTelemetry in the observability stack?
OpenTelemetry provides the standardized APIs and SDKs for instrumenting applications to generate metrics, logs, and traces, eliminating vendor lock-in and ensuring data consistency across all services.
How does distributed tracing differ from basic logging for incident management?
Distributed tracing maps the full request path across services, showing causality and latency, which is often the quickest way to pinpoint the failure source, whereas logging provides detailed, discrete event records.
What problem do Cortex and Thanos solve for Prometheus users?
They solve Prometheus's limitations regarding long-term storage and horizontal scalability, enabling multi-tenant, globally queryable, and highly available metric data storage for large enterprises.
How does Loki achieve cost-effective log storage compared to Elasticsearch?
Loki indexes only metadata (labels) associated with logs, rather than the full log content, making it faster and more storage-efficient for high-volume log data ingestion and querying.
Why are commercial APM tools often integrated, proprietary platforms?
Commercial APM tools offer deep code-level tracing, user experience monitoring, and automated correlation of the three pillars in a single proprietary platform, often leveraging proprietary AI/ML for automated root cause analysis.
What role do API Gateways play in observability data collection?
API Gateways are the first point of entry and are crucial for collecting high-level metrics (e.g., total requests, latency, errors) before traffic hits the internal microservices, providing vital edge visibility.
How is Chaos Engineering related to observability tools?
Chaos engineering experiments (e.g., latency injection via Chaos Mesh) rely on observability tools (metrics, traces) to precisely measure the system's resilience and validate that the service fails and recovers gracefully, as designed.
Why is Grafana Tempo considered cost-efficient for tracing?
Tempo uses object storage (S3/GCS) for high-volume trace storage, which is significantly cheaper than traditional, indexed time-series databases, making it highly scalable and cost-effective for long-term trace retention.
What is the significance of Continuous Profiling in the observability context?
Continuous profiling provides the deepest observability, identifying the exact lines of code consuming CPU, memory, or I/O over time, which is essential for low-level performance optimization and resource efficiency.
How does Fluent Bit aid in containerized observability?
Fluent Bit is a lightweight log processor and forwarder used as a sidecar or daemon on Kubernetes nodes to reliably collect, parse, and route container and host logs to centralized analysis tools, often aligning with RHEL 10 log management best practices.
How does service mesh data enhance observability for microservices?
The service mesh automatically generates uniform metrics, logs, and traces for all network traffic between services, providing deep insights into service-to-service communication and network policy enforcement without code instrumentation.
What is the key advantage of using Jaeger or Zipkin for incident investigation?
Their key advantage is the visualization of the trace path and latency across all services, allowing engineers to instantly pinpoint which service or database call is causing the issue, drastically reducing MTTR.
What must be considered when implementing SELinux in an observable environment?
SELinux policies must be configured to allow monitoring and log agents (like Fluent Bit) the necessary access to system files and sockets to collect telemetry data without compromising the host's security posture, aligning with SELinux best practices.
Why is observability vital for achieving a high-velocity release cadence?
Observability provides high confidence in code changes by giving immediate, deep validation in pre-production and production environments, enabling rapid deployment and safe, quick rollbacks, which is crucial for a fast release cadence.
What's Your Reaction?
 Like
0
Like
0
 Dislike
0
Dislike
0
 Love
0
Love
0
 Funny
0
Funny
0
 Angry
0
Angry
0
 Sad
0
Sad
0
 Wow
0
Wow
0
![100+ Azure DevOps Interview Questions and Answers [Updated 2025]](https://www.devopstraininginstitute.com/blog/uploads/images/202509/image_140x98_68c40aa9a3834.jpg)


![Future Scope of DevOps Careers in Pune [Updated 2025]](https://www.devopstraininginstitute.com/blog/uploads/images/202510/image_140x98_68e3a84652312.jpg)


