


![Kong Interview Preparation Guide [2025]](https://www.devopstraininginstitute.com/blog/uploads/images/202509/image_430x256_68dbb95326997.jpg)


18 Observability Tools That Support Multi-Cloud
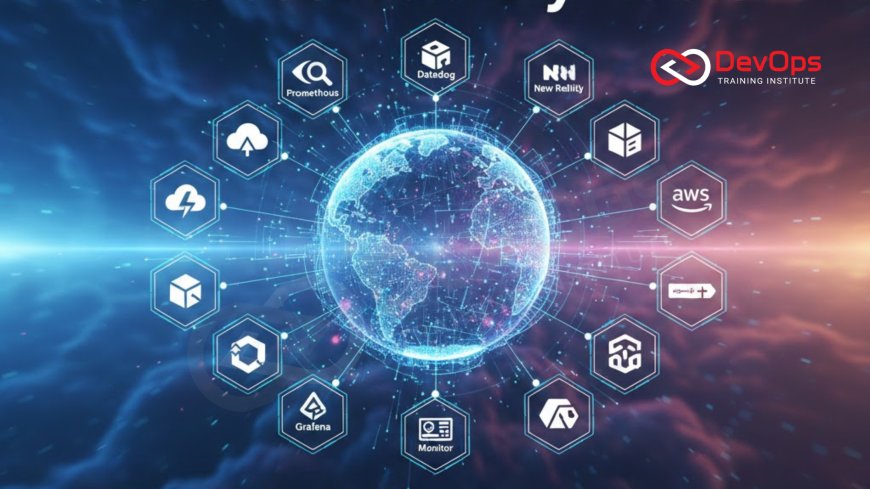
Discover the top eighteen observability tools that provide seamless support for multi-cloud environments in today's complex digital landscape. This comprehensive guide explores essential solutions for monitoring metrics, logs, and traces across AWS, Azure, and Google Cloud Platform. Learn how these powerful tools enhance system visibility, streamline troubleshooting, and empower engineering teams to maintain high availability and performance while managing diverse infrastructure stacks and distributed microservices architectures for their organization.
Introduction to Multi-Cloud Observability
In the current era of enterprise technology, relying on a single cloud provider is becoming rare. Most organizations now adopt a multi-cloud strategy to avoid vendor lock-in, optimize costs, and leverage specific services unique to different platforms. However, this flexibility comes with a significant challenge: maintaining a clear view of system health across diverse environments. Without a unified approach, teams often find themselves struggling with fragmented data and "blind spots" that can lead to delayed incident response and decreased reliability.
Multi-cloud observability is the practice of collecting and analyzing telemetry data from various cloud providers into a single, cohesive view. This allows engineers to understand how their applications behave as they interact with services spanning across AWS, Azure, and Google Cloud. By utilizing advanced 18 observability tools that support multi-cloud, teams can ensure that they have the deep insights necessary to troubleshoot complex issues, optimize performance, and maintain a seamless user experience regardless of where the underlying infrastructure resides. This introduction serves as a roadmap for exploring the tools that make this modern visibility possible.
The Importance of a Unified Visibility Layer
When an application is distributed across multiple clouds, traditional monitoring tools often fail because they are designed for siloed environments. A unified visibility layer acts as a bridge, pulling together metrics, logs, and traces into a centralized dashboard. This integration is vital for performing root cause analysis during an outage. If a service in Azure fails because of a timeout in an AWS database, a multi-cloud tool can show that relationship clearly, saving the team hours of manual investigation across different consoles.
Beyond troubleshooting, a unified view is essential for strategic decision-making. It allows organizations to compare performance and costs across different providers in real-time. This level of insight is a core component of how finops help optimize cloud spend in devops driven teams. By seeing exactly where resources are being utilized efficiently and where waste is occurring, companies can make data-driven adjustments to their multi-cloud architecture. This proactive management ensures that the infrastructure remains both performant and cost-effective, supporting the long-term growth and stability of the digital business.
Modern Pillars: Metrics, Logs, and Traces
To achieve true observability, a tool must handle the three foundational pillars of telemetry: metrics, logs, and traces. Metrics provide a high-level overview of system health through numerical data, such as CPU usage or request counts. Logs offer a detailed record of discrete events, providing the narrative of what happened within a specific service. Traces follow a single request as it moves through various microservices, showing exactly where delays or errors occur in a distributed transaction. A professional tool integrates all three to provide a complete story.
Many beginners often confuse basic monitoring with full observability. Understanding the key differences between observability and monitoring in devops is crucial for choosing the right toolset. Monitoring tells you when something is wrong, but observability allows you to ask "why" it is wrong. By having all pillars of data available in a single multi-cloud platform, engineers can explore the system's internal state without needing to pre-define every possible failure mode. This exploratory capability is essential for managing the unpredictable nature of modern, high-scale software systems.
Top Enterprise Observability Platforms
The market for enterprise observability is led by several powerful platforms that have made multi-cloud support a core part of their offering. Datadog and Dynatrace are two prominent examples that offer extensive integrations with hundreds of different cloud services. These platforms use AI and machine learning to automatically detect anomalies and correlate events across providers. This automation reduces the cognitive load on engineers, allowing them to focus on fixing problems rather than manually sifting through thousands of alerts during a major incident.
New Relic and Splunk also provide comprehensive multi-cloud solutions that excel at handling massive volumes of data. These tools are often part of a broader platform engineering strategy, where the goal is to provide developers with a pre-configured and reliable monitoring environment. By centralizing observability, these platforms help maintain consistent standards across different teams and projects. This ensures that every service, regardless of its cloud host, is held to the same high standards of performance and reliability, fostering a culture of operational excellence throughout the entire engineering organization.
Table: Top 18 Multi-Cloud Observability Tools
| Tool Name | Primary Focus | Cloud Support | Best Feature |
|---|---|---|---|
| Datadog | Full-stack Visibility | AWS, Azure, GCP, Alibaba | Over 700+ native integrations. |
| Dynatrace | AI-powered Insights | AWS, Azure, GCP, Oracle | Davis AI for automated root cause. |
| New Relic | All-in-one Platform | AWS, Azure, GCP | Deep code-level diagnostics (APM). |
| Prometheus | Metrics & Alerting | Any (Cloud-native focus) | Standard for Kubernetes metrics. |
| Grafana | Visualization | Any (Multi-source) | Flexible and beautiful dashboards. |
| Splunk | Log & Data Analytics | AWS, Azure, GCP | Powerful SPL query language for logs. |
| Sumo Logic | Cloud-native Logs | AWS, Azure, GCP | Unified security and ops logs. |
| AppDynamics | Business Performance | AWS, Azure | Connecting tech metrics to business KPIs. |
| Instana (IBM) | Real-time APM | AWS, Azure, GCP | Automatic discovery and mapping. |
| Elastic Stack | Log Search & Metrics | Any (Open-source base) | Search-centric workflow (ELK). |
| Site24x7 | All-in-one Monitoring | AWS, Azure, GCP | Affordable multi-cloud monitoring. |
| LogicMonitor | Infrastructure Focus | AWS, Azure, GCP | Agentless discovery for hybrid setups. |
| Honeycomb | Event Observability | Any | High-cardinality analysis for debugging. |
| Lightstep (ServiceNow) | Distributed Tracing | Any | Change intelligence for deployments. |
| VictoriaMetrics | High-scale Metrics | Any | Superior storage and query speed. |
| Chronosphere | Cloud-native scale | AWS, GCP | Control plane for observability costs. |
| Coralogix | Streaming Analytics | AWS, Azure, GCP | Real-time analysis without high storage fees. |
| Observe | The Observability Cloud | AWS | Snowflake-backed petabyte-scale analysis. |
Open Source Solutions for Multi-Cloud
For teams that prefer to avoid vendor lock-in and have more control over their data, open source solutions provide a powerful alternative. Prometheus and Grafana are the industry standards for managing metrics and creating beautiful, custom dashboards. These tools are highly flexible and can be deployed in any environment, whether on-premise or in the cloud. They are particularly well-suited for Kubernetes-heavy environments, where they can automatically discover and monitor new pods as they are created.
Using open source tools often requires more effort to set up and maintain, but it allows for deeper integration with modern practices like gitops. By defining your monitoring configuration as code in a Git repository, you can ensure that your observability stack remains consistent across all cloud regions. This automated approach reduces the risk of manual configuration errors and makes it much easier to scale your monitoring as your application grows, providing a solid foundation for any multi-cloud strategy.
Enhancing Resilience with Chaos Engineering
True observability is not just about watching the system when it's healthy; it's about understanding how it behaves when things break. This is where the integration of testing and visibility becomes critical. By deliberately injecting faults into a controlled environment, teams can verify if their observability tools actually provide the necessary insights to diagnose the problem. This proactive approach helps identify gaps in monitoring before a real disaster strikes the production environment.
Learning how can chaos engineering improve resilience in devops pipelines allows teams to build more robust and self-healing systems. When a chaos experiment is running, the observability tool acts as the "eyes" of the engineer, showing exactly how the failure cascades through the multi-cloud architecture. This feedback loop is essential for fine-tuning alerts and ensuring that the team is notified of critical issues without being overwhelmed by noise. By breaking things on purpose, you gain the confidence that you can fix them when they break for real.
Deployment Strategies and Observability
The way you release software directly impacts how you monitor it. Modern deployment strategies, such as blue green deployment in kubernetes, allow for safer updates by keeping the old version running while the new one is validated. During this process, observability tools play a vital role in comparing the performance of the two versions. If the new version shows higher latency or error rates, the system can automatically trigger a rollback, protecting the user experience.
Another popular method is the use of a canary release, where the new code is slowly rolled out to a small percentage of users. Observability tools monitor this small group closely for any signs of trouble. This gradual rollout, often controlled by feature flags, minimizes the risk of a widespread outage. By integrating observability directly into the deployment pipeline, teams can achieve a higher level of safety and move faster with confidence that any issue will be detected and addressed immediately.
- Real-time Dashboards: Providing instant visibility into critical KPIs across all cloud providers.
- Automated Alerting: Notifying the right team members when system health thresholds are breached.
- Distributed Tracing: Following requests across microservices to identify performance bottlenecks.
- Anomaly Detection: Using AI to find unusual patterns that might indicate a security or performance issue.
Security and Compliance in Observability
Observability is not just an operations task; it is also a security task. By monitoring logs and network traffic across all clouds, teams can detect unauthorized access or unusual data movement that might indicate a security breach. This integrated approach is a fundamental part of how does devsecops integrate security into every stage of the devops lifecycle. When security data is part of the same platform as performance data, troubleshooting and incident response become much more efficient.
Furthermore, maintaining compliance in a multi-cloud environment requires clear evidence of data protection and access control. Observability tools provide the audit trails necessary to prove that security policies are being followed consistently. This automated governance is essential for organizations in regulated industries. By providing a transparent and searchable history of all system events, these tools help simplify audits and ensure that the organization remains compliant with both internal and external standards. This peace of mind is invaluable for any business operating at scale in the modern cloud era.
Conclusion
In conclusion, managing a multi-cloud environment requires a shift from traditional monitoring to a modern, unified observability strategy. The 18 observability tools we have explored offer a diverse range of features, from AI-powered root cause analysis to open-source flexibility. By integrating metrics, logs, and traces into a single platform, engineering teams can gain the deep insights necessary to maintain high availability and performance across AWS, Azure, and Google Cloud. Furthermore, by incorporating advanced testing and security practices, such as shift left testing and chaos engineering, organizations can build more resilient systems that are prepared for the unpredictable challenges of the digital world. The journey toward full multi-cloud observability is an ongoing process of improvement and automation. Choosing the right toolset is the first step in empowering your team to deliver high-quality software faster while ensuring that every user has a seamless and reliable experience. As the technology landscape continues to evolve, the ability to see and understand your entire system will remain the defining factor in your technical and business success.
Frequently Asked Questions
What is multi-cloud observability?
It is the practice of unifying telemetry data from multiple cloud providers into a single view for better system visibility.
Why is observability important for multi-cloud?
It helps prevent data silos, simplifies troubleshooting across providers, and ensures a consistent user experience regardless of the infrastructure host.
What are the three pillars of observability?
The three foundational pillars are metrics, logs, and traces, which together provide a complete picture of system behavior.
Is Datadog a multi-cloud tool?
Yes, Datadog supports hundreds of integrations across all major cloud providers, making it a leading choice for multi-cloud visibility.
Can I use Prometheus for multi-cloud?
Yes, Prometheus is an open-source tool that can be deployed across different clouds to collect and alert on time-series metrics.
How does AI help in observability?
AI can automatically detect anomalies, correlate events from different clouds, and identify the root cause of an incident without manual effort.
What is distributed tracing?
It is a method of tracking a single request as it travels through various microservices and cloud environments to find delays.
Does observability help reduce cloud costs?
Yes, by identifying idle or underutilized resources across clouds, these tools help teams optimize their spending and improve resource efficiency.
What is the difference between monitoring and observability?
Monitoring tells you if a system is healthy, while observability helps you understand why it is behaving in a certain way.
How do feature flags relate to observability?
Feature flags allow for safe deployments, and observability tools monitor the impact of those new features on system performance in real-time.
What is the ELK stack?
The ELK stack (Elasticsearch, Logstash, Kibana) is a popular open-source solution for searching, analyzing, and visualizing log data.
Is multi-cloud observability expensive?
Costs vary depending on data volume, but many tools offer features to control and optimize costs through streaming analytics and data filtering.
Can observability help with security?
Yes, by monitoring logs and network patterns, these tools can detect potential security threats and unauthorized access across all cloud environments.
What is a Service Level Objective (SLO)?
An SLO is a target level of reliability for a service that observability tools help track and report on consistently.
Should I use open-source or commercial tools?
It depends on your team's expertise and budget; open-source offers more control, while commercial tools provide more out-of-the-box automation and support.
What's Your Reaction?
 Like
0
Like
0
 Dislike
0
Dislike
0
 Love
0
Love
0
 Funny
0
Funny
0
 Angry
0
Angry
0
 Sad
0
Sad
0
 Wow
0
Wow
0
![100+ Azure DevOps Interview Questions and Answers [Updated 2025]](https://www.devopstraininginstitute.com/blog/uploads/images/202509/image_140x98_68c40aa9a3834.jpg)


![Future Scope of DevOps Careers in Pune [Updated 2025]](https://www.devopstraininginstitute.com/blog/uploads/images/202510/image_140x98_68e3a84652312.jpg)


