


![Kong Interview Preparation Guide [2025]](https://www.devopstraininginstitute.com/blog/uploads/images/202509/image_430x256_68dbb95326997.jpg)


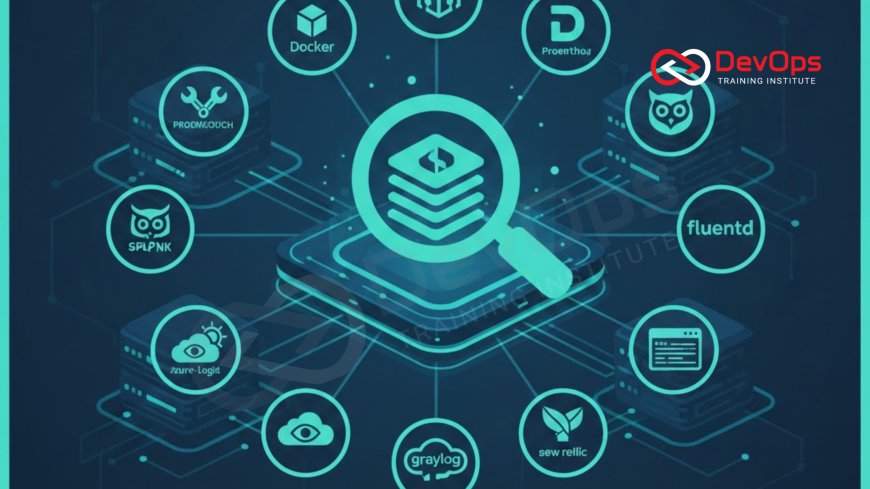
20 DevOps Tools for Log Aggregation & Analysis
Explore a definitive list of 20 powerful DevOps tools engineered for efficient log aggregation and analysis, crucial for maintaining visibility and operational excellence in complex, distributed systems. This extensive guide breaks down essential components like collection agents, scalable storage backends, and sophisticated visualization platforms, including the popular ELK/EFK stacks and leading commercial solutions. Learn how these tools enable proactive monitoring, rapid troubleshooting, enhanced security auditing, and deeper insights into application performance. Ideal for engineers and architects, this resource provides the knowledge needed to build a robust, centralized logging infrastructure that transforms raw data into actionable intelligence, driving continuous improvement.
Introduction
In modern cloud-native and microservices environments, applications are no longer running on a handful of stable, long-lived servers. Instead, they exist across hundreds or even thousands of ephemeral containers, virtual machines, and serverless functions, generating an overwhelming tsunami of log data. This shift from centralized systems to distributed architectures has rendered traditional, file-based log viewing obsolete. Without a centralized logging solution, troubleshooting a complex issue that spans multiple services and servers becomes a time-consuming, nearly impossible task, directly impacting system stability and the speed of recovery. Log aggregation and analysis tools are the essential technological response to this complexity, providing the necessary visibility into the black box of a distributed system.
The journey from raw text files scattered across an infrastructure to actionable insights on a dashboard is managed by a sophisticated toolchain known as a log management system. This system is the cornerstone of observability, working in tandem with metrics and tracing to give DevOps and Site Reliability Engineering (SRE) teams a complete picture of application health. The right combination of tools allows engineers to not only quickly pinpoint the root cause of an outage but also to proactively identify performance degradation, security threats, and operational bottlenecks before they impact the end-user. This guide serves as a comprehensive overview of 20 essential tools that power this critical infrastructure, detailing their roles and showing how they fit into a cohesive logging strategy.
Why Centralized Logging is Non-Negotiable
For any organization operating at scale, relying on manual SSH access to hundreds of servers to search through plain text log files is inefficient and introduces significant operational risk. Centralized logging solves this problem by consolidating all log output from every source (applications, web servers, operating systems, network devices) into a single, searchable platform. This immediate access to all relevant data streams is vital for achieving low Mean Time to Recover (MTTR) during incidents. When an outage occurs, engineers can correlate events across different services and timelines in seconds, drastically reducing the time spent diagnosing the problem and accelerating the path to resolution, which is a key goal of every elite DevOps team.
Beyond rapid troubleshooting, a centralized logging infrastructure is critical for security and compliance. Log data provides the essential audit trail for every action taken within a system, whether by a user or an automated process. By analyzing these logs, organizations can detect attempted intrusions, track unauthorized access, and fulfill regulatory requirements for data retention and auditing. For instance, monitoring for failed login attempts or unauthorized attempts to access critical files requires aggregating and analyzing logs from authentication services, firewalls, and operating systems. This focus on verifiable data is what transforms log management from a convenience into a core business requirement, ensuring that the necessary audit trails are readily available when they are required for investigation or legal review.
A further, often overlooked, benefit of robust logging is its role in providing operational feedback to the development process. By analyzing log patterns, engineers can gain deep insights into application behavior under real-world load. They can identify code paths that generate excessive warnings, detect potential memory leaks, or pinpoint race conditions that only manifest in production. This data-driven feedback loop allows teams to continuously refine their code, improve logging standards, and make informed architectural decisions. Without this continuous stream of insights from the production environment, the continuous improvement cycle essential to DevOps quickly breaks down, leading to stagnation in both product quality and delivery efficiency.
The Core Architecture of Log Management Systems
Modern log management systems are typically built upon three functional layers that work in concert to handle the high volume and velocity of log data. Understanding this architecture is key to selecting the right tools and designing a scalable solution. The three layers are: the Collection Layer, the Aggregation and Storage Layer, and the Analysis and Visualization Layer. Each layer is typically composed of specialized tools designed to perform their specific function efficiently, ensuring that the overall pipeline can manage massive log streams with minimal latency, transforming raw output into structured data along the way.
The Collection Layer involves lightweight agents installed on every host, container, or application process. Their sole job is to tail log files, capture standard output, and forward this data stream efficiently to the aggregation layer. Tools in this layer must be highly performant, use minimal system resources, and be capable of handling temporary network outages by buffering data locally. The Collection Layer is critical for ensuring that log data is captured at the source and reliably transmitted without loss, regardless of the host's stability or the volume of logs being produced. This layer often requires careful management of user roles and permissions for the agents to access the necessary log files across the operating system.
The Aggregation and Storage Layer receives the data streams from the collection agents. This layer often includes a message queue or buffering component to handle bursts of data, protecting the downstream storage system from being overwhelmed. The data is then parsed, filtered, and transformed into a standardized, structured format (like JSON) before being indexed for fast searching. Elasticsearch and Loki are two popular tools in this layer, providing the scalable, distributed backend necessary to store petabytes of data and execute complex search queries across billions of log entries in milliseconds. This is where the sheer volume of data is tamed and prepared for actionable analysis by end-users.
The final Analysis and Visualization Layer is the user interface where engineers interact with the aggregated data. Tools in this layer allow users to search, filter, build dashboards, generate reports, and set up alerts based on specific log patterns or metrics derived from the logs. Kibana and Grafana are dominant tools here, offering intuitive interfaces for querying the log store and creating visual representations of system behavior. This layer closes the feedback loop, translating the stored data into the operational insights needed to drive incident response and continuous improvement initiatives, ensuring the entire logging stack provides maximum utility to the end engineering teams.
Tool Category Collection and Forwarding Agents
The collection layer is vital because the choice of agent impacts system performance and the reliability of the entire log pipeline. The agent must be highly efficient, especially on resource-constrained environments like containers and small virtual machines. These forwarders are typically configured to monitor specific directories or application outputs and apply basic filtering before transmission. Security is also paramount, as the agents often handle sensitive log data and must be configured with secure access protocols to transmit data securely over the network and avoid man-in-the-middle attacks, ensuring that log data remains confidential from the point of creation to the point of storage.
The following agents are widely used for robust log collection:
- Filebeat: Developed by Elastic, Filebeat is a lightweight shipper designed specifically to tail log files and forward them to Elasticsearch or Logstash. It is known for its minimal resource consumption and reliable "at-least-once" delivery guarantee, making it an excellent choice for Kubernetes and busy production hosts.
- Fluentd: An open-source data collector that supports a massive plugin ecosystem, allowing it to collect logs from almost any source and output to hundreds of different destinations. Fluentd's flexibility and robust buffering mechanisms make it a favorite for complex multi-cloud and multi-destination logging requirements.
- Logstash: Part of the original ELK stack, Logstash is a powerful, more resource-intensive pipeline engine that specializes in advanced data ingestion, filtering, and transformation. While often used for collection, its strength lies in complex event processing before data is indexed, making it ideal for standardizing unstructured log formats into clean, searchable JSON.
- Vector: A modern, high-performance, open-source observability data pipeline that can collect, transform, and route all forms of telemetry data, including logs, metrics, and traces. Written in Rust, Vector is known for its superior performance and resource efficiency compared to older collectors, positioning it as a strong contender for next-generation log collection infrastructure, especially in cloud-native setups.
- rsyslog / syslog-ng: These traditional Linux system logging daemons are still widely used, particularly for collecting operating system and system service logs. While older, they are deeply integrated into the OS and offer reliable forwarding capabilities, often acting as the initial collection point before structured logging tools take over the stream.
Twenty Essential Tools for Log Aggregation and Analysis
| Tool Name | Primary Function | Architectural Layer | Deployment Model |
|---|---|---|---|
| Elasticsearch | Scalable, distributed search and analytics engine. | Aggregation / Storage | Open Source / Self-Hosted or Cloud |
| Kibana | Visualization, dashboarding, and log exploration UI for Elasticsearch. | Analysis / Visualization | Open Source / Self-Hosted or Cloud |
| Logstash | Server-side data processing pipeline (input, filter, output). | Collection / Aggregation | Open Source / Self-Hosted |
| Fluentd | Unified logging layer and data collector with rich plugins. | Collection / Forwarding | Open Source / Self-Hosted |
| Loki | Scalable, index-lite log aggregation system optimized for cost. | Aggregation / Storage | Open Source / Self-Hosted |
| Grafana | Universal visualization and dashboarding tool that queries Loki, Prometheus, etc. | Analysis / Visualization | Open Source / Self-Hosted or Cloud |
| Splunk | Market-leading platform for searching, monitoring, and analyzing machine-generated data. | All-in-One / Commercial | Commercial / Cloud or Self-Hosted |
| Datadog | Unified cloud monitoring, tracing, and log management platform. | All-in-One / Commercial | Commercial / SaaS |
| Sumo Logic | Cloud-native, real-time log analysis and security intelligence platform. | All-in-One / Commercial | Commercial / SaaS |
| Graylog | Open-source log management tool with a focus on ease of use and alerts. | All-in-One / Open Source | Open Source / Self-Hosted |
| Filebeat | Lightweight log shipper (Beat) from the Elastic stack. | Collection / Forwarding | Open Source / Self-Hosted |
| Vector | High-performance telemetry data router and processing pipeline. | Collection / Forwarding | Open Source / Self-Hosted |
| Apache Kafka | Distributed streaming platform often used as a log buffer/message queue. | Aggregation / Buffer | Open Source / Self-Hosted |
| New Relic | Observability platform providing log management integrated with APM. | All-in-One / Commercial | Commercial / SaaS |
| CloudWatch Logs (AWS) | AWS native service for monitoring, storing, and accessing log files. | All-in-One / Cloud Native | Commercial / SaaS |
| Log Analytics (Azure) | Azure native service for managing and analyzing large volumes of log data. | All-in-One / Cloud Native | Commercial / SaaS |
| GCP Logging (Stackdriver) | Google Cloud native log management and analysis service. | All-in-One / Cloud Native | Commercial / SaaS |
| rsyslog | Linux system logging daemon with forwarding capabilities. | Collection / OS Native | Open Source / Self-Hosted |
| syslog-ng | Enhanced, modular syslog implementation for collecting and forwarding logs. | Collection / OS Native | Open Source / Self-Hosted |
| Prometheus | Time-series database, often integrated with logging for metric correlation. | Metrics / Monitoring | Open Source / Self-Hosted |
Aggregation Storage and Indexing Backends
The aggregation and storage layer is the backbone of the logging system, responsible for storing immense volumes of data while maintaining the ability to execute complex, high-speed queries. This layer must be scalable, fault-tolerant, and designed to manage the specific characteristics of log data, which is high-volume and append-only. The architecture often revolves around distributed database technologies that can partition data across multiple nodes, ensuring that a hardware failure does not result in the loss of critical log history. The indexing strategy employed by these backends determines the speed of searching, as logs must be indexed in a way that allows for fast text search and time-series analysis.
Elasticsearch is the dominant tool in this layer, forming the core storage component of the widely adopted ELK (Elasticsearch, Logstash, Kibana) stack, and the EFK (Elasticsearch, Fluentd, Kibana) stack. It is a powerful, highly scalable, full-text search and analytics engine built on Apache Lucene. Elasticsearch is designed for near real-time ingestion and provides a robust RESTful API for querying, making it ideal for the dynamic, high-volume nature of log data. It handles indexing by breaking down logs into searchable tokens and distributing the data across a cluster of nodes. However, managing and scaling a large Elasticsearch cluster requires significant operational expertise and careful resource planning, especially when dealing with petabytes of data.
A notable challenger in the storage space is Loki, a log aggregation system from Grafana Labs. Loki is unique in that it chooses to index metadata about the logs (such as labels and tags, similar to Prometheus) rather than indexing the full text of every log line. This "index-lite" approach significantly reduces storage costs and operational complexity compared to Elasticsearch. By using Grafana for querying, which is optimized for time-series metrics, Loki efficiently stores the logs as simple files and relies on tags for initial filtering. This cost-effective architecture makes Loki a favorite for cloud-native organizations, especially those already leveraging Prometheus for metrics, simplifying the process of correlating logs with existing time-series data without the overhead of full-text indexing, dramatically changing the cost dynamic of log management for many users.
For organizations needing to decouple the ingestion pipeline, Apache Kafka is often inserted between the collection agents and the final storage backend. Kafka is a distributed streaming platform that acts as a highly resilient, partitioned message queue. By using Kafka, teams can buffer massive spikes in log data, preventing the storage backend from being overwhelmed during peak load events. This buffering also provides a temporal decoupling, allowing the storage system to be taken offline for maintenance or upgrades without interrupting the log ingestion from the forwarders. Kafka’s presence is a secret to building truly fault-tolerant logging pipelines, ensuring that logs are reliably queued and delivered even under extreme operational duress, securing the log stream integrity.
Analysis Visualization and Alerting Platforms
Once logs are collected and indexed, their value is realized through the visualization and analysis tools. This layer is the primary interface for DevOps teams, providing the search functionality, intuitive dashboards, and alerting mechanisms necessary to translate raw log entries into actionable intelligence. The focus here is on usability, speed of query execution, and the ability to correlate log data with other observability signals, such as metrics and traces. Effective visualization helps engineers identify patterns and anomalies that would be impossible to spot by looking at individual log entries, transforming a pile of data into a coherent narrative of system performance and behavior.
Kibana is the standard visualization tool for the Elasticsearch backend. It provides powerful features for searching logs using a Lucene query language, allowing users to drill down into specific events and timeframes. Its core strength lies in its dashboarding capabilities, which allow engineers to build customized views of log data, often showing trend lines of error rates, counts of specific events, and geographic distributions of traffic. Kibana’s tightly coupled nature with Elasticsearch makes it a high-performance choice for analyzing ELK stack data. However, the interface and query language can sometimes present a steep learning curve for beginners who are new to log querying principles, but its power is undeniable.
Grafana has emerged as a universal dashboarding tool, capable of visualizing data from a vast array of sources, including Prometheus (metrics), Jaeger (traces), and importantly, Loki and Elasticsearch (logs). Grafana’s flexibility allows teams to create "unified dashboards" that correlate logs with metrics and traces on the same screen, which is essential for comprehensive root cause analysis. For instance, an engineer can see a spike in CPU usage (from Prometheus metrics) and immediately pivot to the corresponding application error logs (from Loki) in the same time range. This multi-source capability has made Grafana a favorite in cloud-native environments, providing a single pane of glass for all observability data, improving the speed and effectiveness of incident response efforts.
Beyond visualization, these tools are essential for setting up proactive security policies and alerting. Engineers configure alerts to trigger based on thresholds, such as a sudden increase in 4xx or 5xx errors, a high volume of failed authentication attempts, or the appearance of specific security-related keywords in the log stream. These alerts are critical for catching problems before they become service-impacting incidents. The sophistication of these alerting systems is often tied to the underlying search engine's performance, as the alerting logic must be executed against the log stream in near real-time. This combination of visualization and alerting transforms passive log data into an active defense and monitoring system, ensuring that teams are immediately notified when intervention is required, often mitigating issues before they impact customers.
Commercial and Cloud Native Observability Suites
While the ELK and EFK stacks provide powerful, open-source solutions, many organizations opt for fully managed commercial or cloud-native observability suites. These all-in-one platforms bundle collection, aggregation, storage, and analysis into a single subscription service, eliminating the substantial operational burden of managing and scaling a large distributed logging infrastructure. This trade-off of open-source flexibility for managed convenience is often justified by the complexity and scale of modern applications, allowing DevOps teams to focus purely on application delivery rather than infrastructure maintenance.
Splunk is the long-established market leader, offering a powerful proprietary data store and an extensive suite of features for log analysis, security information, and event management (SIEM). Splunk’s strength lies in its powerful search language, app ecosystem, and the integration of machine learning capabilities to detect anomalies and predict system failures. Similarly, cloud-native services like AWS CloudWatch Logs and GCP Logging (Stackdriver) provide deeply integrated, fully managed logging solutions that seamlessly ingest logs from services running within their respective cloud ecosystems. These cloud-native solutions benefit from automatic scaling and pay-as-you-go pricing, making them particularly attractive to organizations committed to a single cloud provider, simplifying managing file system integrity and compliance within that environment.
The new wave of commercial tools like Datadog, Sumo Logic, and New Relic offer unified observability platforms that combine logs with metrics and traces from the ground up. Datadog, for instance, provides a single agent for collecting all three telemetry types, enabling immediate correlation and reducing agent sprawl. These platforms often use machine learning to perform automated log pattern detection, summarizing millions of log lines into key findings, which drastically accelerates root cause analysis. While these commercial solutions represent a higher operating expenditure, the reduction in operational toil and the integrated advanced features, such as automated alert configuration and unified billing, often provide a compelling value proposition for large-scale enterprise deployments, allowing engineering teams to leverage complex analysis without building and maintaining the infrastructure themselves.
Security Compliance and Operational Efficiency
In the context of log aggregation, security and compliance are paramount. Log data often contains sensitive information, including user data, IP addresses, system configuration details, and authentication tokens. Therefore, the entire log pipeline must be secured from end-to-end. This starts at the collection point, ensuring the agents transmit data over encrypted channels (TLS/SSL). At the storage layer, strict access controls and role-based access must be enforced, allowing only authorized personnel to query sensitive logs. Regularly auditing the logs themselves is crucial for compliance, requiring retention policies that often demand log data be retained for months or years, which is why a separate system is often required to archive and store historical records safely.
Operational efficiency is also a major consideration, especially concerning the cost of storage. Log data is typically high-volume but has a decreasing value over time. While real-time logs (last 7 days) need fast, indexed storage (Elasticsearch), older logs can be moved to cheaper, less performant storage tiers. This is managed by features like Elasticsearch's Index Lifecycle Management or by offloading data to cloud storage buckets (S3, GCS) where it can be retrieved if needed. The ability to efficiently compress and manage this historical data is essential for controlling cloud costs. Tools that enable this tiered storage, often involving the use of gzip, bzip2, or xz compression formats, are critical for maintaining a financially sustainable log aggregation platform at petabyte scale, ensuring that the cost of storage does not negate the operational benefits of retaining historical data for compliance and analysis purposes.
The successful implementation of centralized logging requires attention to all of these details, ensuring that logs are collected completely, stored securely, and analyzed efficiently. The integration of logging with other DevOps tools, such as metrics (Prometheus), CI/CD pipelines, and configuration management systems, creates a truly unified observability environment. This environment allows engineers to quickly trace a deployment failure back to a specific code commit, correlate the deployment with a spike in error logs, and immediately pinpoint the root cause—a feat impossible without a fully integrated logging and monitoring stack. This comprehensive approach is what defines operational excellence in modern software delivery, leveraging data to drive reliability and development speed.
Conclusion
The evolution of software architectures from monolithic systems to microservices has made centralized log aggregation and analysis an indispensable capability for all high-performing DevOps teams. The sheer scale and complexity of modern systems necessitate a robust log management stack that can ingest, index, and analyze petabytes of data in real-time. By leveraging the power of the 20 tools discussed, organizations can build solutions that perfectly balance cost, performance, and flexibility, whether they choose the open-source strength of the ELK/EFK stack or the convenience and integrated features of commercial suites like Splunk and Datadog. The choice of tool is less important than the commitment to a centralized logging strategy itself.
Successful log management is defined by three outcomes: minimal MTTR during incidents, ironclad security compliance, and continuous operational insight. These tools empower engineers to not only react to failures faster but to proactively prevent them by identifying subtle patterns and anomalies. By focusing on the three architectural layers—efficient collection via agents like Filebeat and Fluentd, scalable storage via Elasticsearch or Loki, and actionable visualization via Kibana or Grafana—leaders can transform raw machine data into the strategic asset that drives reliability and innovation. The full implementation of these tools and practices is the final, non-negotiable step toward achieving true observability and operational excellence in the modern software landscape, guaranteeing that engineering teams are never operating blind.
Frequently Asked Questions
What is the primary architectural purpose of a log collector like Fluentd?
The primary purpose is to reliably tail log files or output streams and forward the data to the central aggregation system with minimal resource use.
What is the main difference between Elasticsearch and Loki storage backends?
Elasticsearch indexes the full log text for fast searches. Loki indexes only log metadata like labels to significantly reduce storage cost and complexity.
How does Logstash differ from Filebeat in the ELK stack?
Filebeat is a lightweight shipper that collects data. Logstash is a heavier processing engine that filters and transforms data before indexing.
Why is Apache Kafka often used in log aggregation pipelines?
Kafka acts as a highly available message buffer, absorbing spikes in log volume and protecting the downstream storage backend from overload.
How do centralized logs enhance security auditing?
Centralized logs provide a complete, immutable audit trail of all system activities, which is necessary for detecting intrusions and maintaining compliance.
What is a key benefit of commercial tools like Datadog over open source?
Commercial tools offer a unified platform that integrates logs, metrics, and traces out-of-the-box, removing the burden of maintaining infrastructure.
How do you ensure log forwarders have proper file access on Linux hosts?
You must configure the agents with appropriate user roles and permissions, ensuring the service account can read the required log files.
What is an effective strategy for managing the rising cost of log storage?
An effective strategy is tiered storage, moving older, less valuable log data to cheaper, long-term storage buckets after a defined retention period.
How does Grafana query logs from both Prometheus and Loki simultaneously?
Grafana uses separate data source plugins (Prometheus for metrics, Loki for logs) and correlates the data using shared labels and time ranges on a dashboard.
What is meant by the "index-lite" approach of Loki?
It means Loki indexes only metadata (labels) about the logs, not the entire log content, saving vast amounts of indexing overhead and cost.
Why is securing log data transmission with TLS/SSL critical?
Log data often contains sensitive information, making encrypted transmission critical for security to prevent eavesdropping and man-in-the-middle attacks.
What is a practical use case for setting up log-based alerting?
A practical use is setting an alert to fire if the volume of 500-level HTTP errors in the logs exceeds a predefined threshold within a five-minute window.
Which logging tool is deeply integrated with Linux operating system files?
Tools like rsyslog and syslog-ng are deeply integrated as native OS logging daemons for collecting system events and logs.
What must you ensure about log files when setting up a reliable backup strategy?
You must ensure the log collection agent is configured to rotate or compress logs, allowing the backup system to reliably capture complete files.
How do tools handle the long-term archival of log data?
Tools export old log data to highly durable, low-cost cloud storage services like AWS S3, often using tar and gzip security practices for compression.
What's Your Reaction?
 Like
0
Like
0
 Dislike
0
Dislike
0
 Love
0
Love
0
 Funny
0
Funny
0
 Angry
0
Angry
0
 Sad
0
Sad
0
 Wow
0
Wow
0

![100+ Azure DevOps Interview Questions and Answers [Updated 2025]](https://www.devopstraininginstitute.com/blog/uploads/images/202509/image_140x98_68c40aa9a3834.jpg)


![Future Scope of DevOps Careers in Pune [Updated 2025]](https://www.devopstraininginstitute.com/blog/uploads/images/202510/image_140x98_68e3a84652312.jpg)


