


![Kong Interview Preparation Guide [2025]](https://www.devopstraininginstitute.com/blog/uploads/images/202509/image_430x256_68dbb95326997.jpg)


How Does Serverless DevOps Change Application Monitoring Practices?
Serverless computing fundamentally changes application monitoring from server-centric metrics to a more granular, event-driven model. This blog post explores the shift from traditional monitoring to observability, highlighting the new challenges and key metrics in a serverless world. Learn how to leverage logs, traces, and metrics to ensure the health of your serverless applications, reduce troubleshooting time, and build a more resilient and efficient DevOps pipeline.
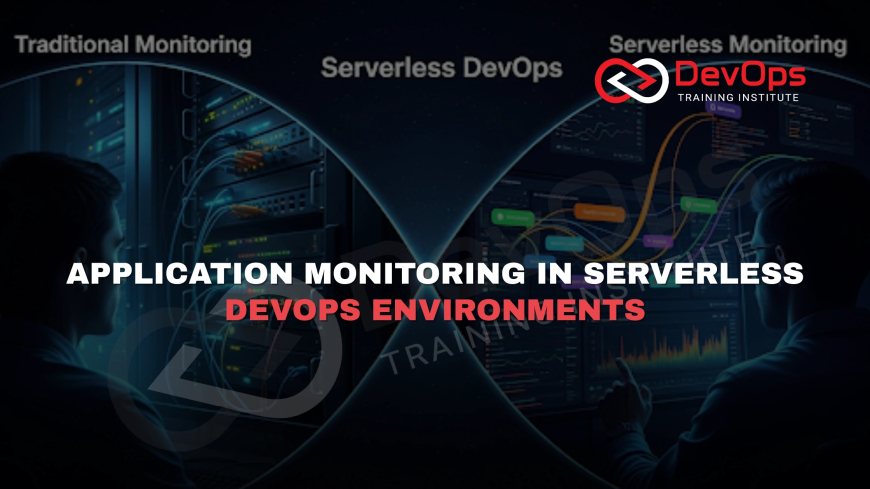
Table of Contents
- The Paradigm Shift: From Servers to Functions
- From Monitoring to Observability
- New Challenges in a Serverless World
- Key Metrics for Serverless Success
- The Role of Observability in Serverless DevOps
- Leveraging Cloud-Native and Third-Party Tools
- Conclusion
- Frequently Asked Questions
The Paradigm Shift: From Servers to Functions
The rise of serverless computing has fundamentally altered the landscape of DevOps. By abstracting away the underlying infrastructure, serverless platforms like AWS Lambda, Azure Functions, and Google Cloud Functions allow developers to focus on writing code and building features without worrying about provisioning, patching, or scaling servers. This shift from managing infrastructure to managing code has had a profound impact on every aspect of the DevOps lifecycle, but perhaps none more so than on application monitoring. In a traditional environment, monitoring practices revolve around the health of servers. Teams track metrics like CPU utilization, RAM usage, and disk space. When a server goes down or a key metric crosses a threshold, an alert is triggered, and a human engineer intervenes. This proactive, server-centric approach is the cornerstone of traditional monitoring.
In a serverless environment, this model becomes obsolete. There are no servers to monitor. Functions are ephemeral, executing for a few seconds or milliseconds before disappearing entirely. A single application might consist of dozens or even hundreds of interconnected functions, databases, and managed services. In this distributed, event-driven world, traditional monitoring metrics provide no meaningful insight. You cannot monitor the CPU of a function that exists for only 500 milliseconds. This forces a complete re-evaluation of how teams measure the health and performance of their applications. The focus shifts from the health of the underlying host to the health of the application itself. The new questions are: Is the function executing successfully? How long is it taking to respond? Is it encountering any errors? This paradigm shift is the core of what makes serverless monitoring so different and so challenging. It requires a move away from infrastructure-level metrics and toward a more granular, event-based observability model that provides a holistic view of the entire application ecosystem, not just its individual components.
From Monitoring to Observability
The term "monitoring" often implies a reactive approach—setting up alerts for known failure modes. In a serverless world, the sheer number of possible interactions and unpredictable events makes it impossible to define every alert rule in advance. This is why DevOps teams are increasingly adopting the concept of observability.
What Is Observability?
Observability is a property of a system that allows you to understand its internal state by examining its external outputs. It is a more proactive and sophisticated approach than simple monitoring. Instead of just knowing that a system is "up" or "down," observability provides a deep, granular understanding of why a system is behaving a certain way. This is achieved by collecting and analyzing three types of telemetry data: logs, metrics, and traces. These three pillars work together to provide a comprehensive picture of your serverless application's health and performance. Logs provide detailed, timestamped events. Metrics give you quantitative data. Traces show the end-to-end journey of a single request. By combining these, you can get the full story of a user interaction, even as it bounces between dozens of different services and functions.
Tool Comparison Table
| Pillar of Observability | What it is | Why it's Crucial for Serverless |
|---|---|---|
| Metrics | Numerical data collected at regular intervals. | Track function-level performance (duration, errors, invocations) without a server. |
| Logs | Timestamped records of events. | Provide granular detail for debugging specific function failures or unexpected behavior. |
| Traces | End-to-end journey of a single request. | Help visualize and debug the complex flow of a request across multiple functions and services. |
The Importance of a Single Pane of Glass?
In a serverless environment, data comes from a variety of sources: AWS Lambda logs, DynamoDB metrics, SQS queues, API Gateway events, and more. Toggling between multiple dashboards from different services is not a sustainable practice. A key challenge is centralizing all of this data into a single, unified "pane of glass" that provides a holistic view of the application. Specialized serverless observability platforms, as well as cloud-native tools, are designed to pull this disparate data together, correlate it, and present it in a way that simplifies troubleshooting, performance optimization, and incident response. This unified view is essential for navigating the inherent complexity of a distributed, serverless architecture and for understanding the cause of an issue that might originate in one service but manifest as a failure in another.
New Challenges in a Serverless World
While serverless simplifies infrastructure management, it introduces a new set of unique monitoring and operational challenges that DevOps teams must be prepared to address.
Limited Infrastructure Visibility?
The primary benefit of serverless—not having to manage servers—is also its biggest challenge from a monitoring perspective. You lose all direct access to the underlying OS and hardware. You cannot SSH into a machine to check a process or run a diagnostic tool. This means you are entirely dependent on the telemetry data exposed by the cloud provider. If the vendor doesn't provide a specific metric or log, you are effectively blind to that part of the system's performance. This lack of direct control forces a more philosophical approach to debugging, relying on high-quality logs, traces, and metrics to infer the internal state rather than directly observing it.
Ephemeral and Distributed Nature?
The short lifespan of serverless functions presents a significant challenge for traditional monitoring tools. An invocation might last for a few hundred milliseconds, making it difficult for an agent to even attach and collect a data point. Furthermore, a single user action might trigger a chain of multiple functions. For example, a user upload might trigger a function to process the image, which then triggers another function to store it in a database, which finally triggers a third function to send a notification. Tracing this end-to-end flow is a complex task that requires specialized tools designed for distributed architectures. Manual log correlation is not a scalable or efficient solution for a system with hundreds of functions executing millions of times a day.
Cold Starts and Latency?
A "cold start" occurs when a function that has not been invoked recently is called. The cloud provider has to spin up a new container and initialize the execution environment, which can add a significant delay (from a few hundred milliseconds to several seconds) to the response time. For user-facing applications, a high frequency of cold starts can negatively impact the user experience. Monitoring cold start latency is a critical metric in serverless, as it gives you a clear picture of the application's responsiveness and helps you identify functions that might need to be "warmed up" or refactored for better performance.
Vendor Lock-in and Cost Complexity?
Every cloud provider has its own set of monitoring and logging tools (AWS CloudWatch, Azure Monitor, Google Cloud Logging). Using a multi-cloud or hybrid-cloud strategy can create a fragmented monitoring experience. Additionally, the pay-per-execution model introduces a new set of cost-related challenges. A single bug that puts a function in an infinite loop could lead to millions of invocations and an unexpectedly high bill. Monitoring invocation count and duration is no longer just about performance; it's a vital part of financial management and cost optimization.
Key Metrics for Serverless Success
Since traditional server-based metrics are no longer relevant, DevOps teams must pivot to a new set of key performance indicators (KPIs) that are specific to the serverless paradigm.
Function-Level Metrics?
These are the most basic and important metrics for a serverless application. The most critical ones are:
Invocation Count: The total number of times a function is executed. A sudden spike or drop can indicate an issue.
Duration: The time it takes for a function to execute. This is a primary measure of performance and is a key indicator of latency.
Error Rate: The percentage of function invocations that result in a failure.
Throttling: The number of times a function is limited by the cloud provider due to concurrent execution limits. A high throttling rate indicates a need for a concurrency limit increase or an architectural change.
Memory Usage: The amount of memory a function consumes. This is both a performance and a cost optimization metric, as you pay for the memory a function uses.
By monitoring these metrics, teams can get an immediate, granular view of their application's health and can quickly pinpoint which functions are underperforming or failing. This allows for a more targeted and efficient debugging process, which is critical in a distributed system where a single point of failure can be difficult to find.
Business and Latency Metrics?
Beyond technical metrics, a modern monitoring strategy must also include business-level metrics to gauge the application's true impact. For a retail application, this might mean tracking the success rate of the "checkout" function, the number of new user sign-ups, or the total revenue processed. By correlating these business metrics with technical metrics like function duration, teams can understand how a performance degradation directly impacts the bottom line. For example, a slight increase in a payment function's duration might correlate with a decrease in the number of successful checkouts. This correlation provides a powerful justification for prioritizing a performance fix.
Cost Metrics?
In a serverless environment, every invocation costs money. A bug that causes a function to execute in an infinite loop can lead to thousands of dollars in unexpected charges. Monitoring invocation count is not just a performance metric; it is a financial control. By setting alerts on a sudden spike in invocations, teams can prevent a runaway function from leading to a significant financial loss. This is a unique and critical aspect of serverless monitoring that did not exist in the traditional server-based model.
The Role of Observability in Serverless DevOps
In a serverless world, observability is not a luxury; it is the very foundation of an effective DevOps practice. It empowers teams to handle the unique challenges of serverless and to achieve the core goals of DevOps.
Enabling Faster Troubleshooting?
When an issue occurs in a complex serverless application, finding the root cause is like finding a needle in a haystack. Distributed tracing helps visualize the entire request flow, allowing teams to quickly identify the specific function or service that failed. Centralized logs and metrics provide the necessary context to understand why it failed. This combination of data streams significantly reduces the time to diagnose a problem, which is a key component of a low MTTR (Mean Time to Resolution). It moves teams from a reactive "firefighting" model to a proactive, data-driven one, where they can resolve issues more quickly and with more confidence.
Enhancing Performance Optimization?
Observability provides the data needed to optimize serverless functions. By monitoring duration, memory usage, and cold starts, teams can identify performance bottlenecks. For example, they might discover that a function's latency is high due to a cold start. They can then optimize by provisioning a higher memory allocation or by using a "provisioned concurrency" setting to keep the function warm. This continuous cycle of monitoring, analysis, and optimization is a core part of serverless DevOps and is directly enabled by a robust observability platform. Without a deep understanding of how functions perform in the wild, optimization efforts would be based on guesswork, not on hard data.
Automating Response and Remediation?
The ultimate goal of observability is to move beyond manual intervention and enable automated response. By setting up alert rules on key metrics, teams can trigger automated actions. For example, if a function's error rate exceeds a certain threshold, a serverless "self-healing" system can be triggered to either roll back a recent deployment or send a notification to a specific team. This moves the operational practice beyond human-driven response and into a world of autonomous, intelligent systems that can resolve issues instantly, which is the final step in a truly mature serverless DevOps pipeline.
Leveraging Cloud-Native and Third-Party Tools
The serverless ecosystem has evolved with a wide range of tools designed to meet its unique monitoring needs. DevOps teams can either leverage cloud-native solutions or integrate with a third-party observability platform to get a holistic view of their applications.
Cloud-Native Tools?
Each major cloud provider offers its own suite of integrated monitoring tools. AWS has CloudWatch (for metrics and logs) and X-Ray (for distributed tracing). Azure has Azure Monitor, and Google Cloud has Stackdriver (now part of Google Cloud's operations suite). These tools are tightly integrated with their respective serverless offerings and are an excellent starting point for any team. They are typically easy to set up and provide a solid foundation for collecting basic telemetry data. However, they can be less effective in a multi-cloud or hybrid-cloud environment and may lack some of the advanced features offered by third-party platforms.
Third-Party Observability Platforms?
Specialized platforms like Datadog, New Relic, and Dynatrace provide a unified "single pane of glass" experience. They can ingest data from multiple cloud providers and on-premise systems, providing a consistent monitoring experience. These platforms often come with advanced features like AI-powered anomaly detection, customizable dashboards, and robust alerting, which can be invaluable for large-scale, complex serverless applications. They offer a level of cross-platform visibility and analytics that cloud-native tools often can't match. The choice between a cloud-native and a third-party tool often comes down to the scale and complexity of the application, as well as the team's needs for a unified, multi-cloud monitoring solution.
Conclusion
Serverless computing fundamentally reshapes the application monitoring landscape. The traditional focus on server health is replaced by a more granular, distributed, and event-driven observability model. DevOps teams must pivot their practices, moving away from simple monitoring of infrastructure metrics and embracing the collection and analysis of logs, metrics, and traces from ephemeral functions. This shift is essential for addressing the unique challenges of serverless, such as limited visibility, distributed complexity, and cold start latency. By adopting a robust observability strategy, teams can gain the deep insights needed for faster troubleshooting, smarter performance optimization, and proactive, automated remediation. This enables them to not only ensure the reliability of their serverless applications but also to fully realize the promise of a high-velocity, resilient DevOps pipeline in the age of serverless computing.
Frequently Asked Questions
How does serverless change the definition of "uptime"?
In a traditional model, uptime refers to a server being online and accessible. In serverless, where there are no persistent servers, uptime is defined by the availability and health of the application's functions and services. The focus is not on whether a server is running, but on whether a user request is successfully processed from end to end, with acceptable latency and zero errors.
Why are traditional monitoring agents not useful in serverless?
Traditional monitoring agents are designed to run on a persistent server to continuously collect data like CPU and memory usage. In a serverless environment, functions are ephemeral and run for only a few milliseconds, making it impossible for a traditional agent to install, run, and collect meaningful data. This is why you must rely on event-based and function-level metrics.
What is the difference between monitoring and observability in this context?
Monitoring is a reactive practice that involves collecting metrics and setting alerts for known problems (e.g., "alert if CPU exceeds 80%"). Observability is a more proactive and holistic concept that provides the tools to ask new questions about a system's internal state. It allows you to understand why an issue is occurring, even for problems you have never seen before.
What are the "three pillars of observability"?
The three pillars of observability are logs, metrics, and traces. Logs provide detailed records of events. Metrics are numerical data like invocation count and duration. Traces show the end-to-end journey of a request through a distributed system. Together, they provide a comprehensive view of a serverless application's health and performance, which is essential for effective debugging.
How does serverless monitoring help with cost optimization?
In a serverless model, you pay per execution and per duration. Monitoring these specific metrics is therefore crucial for cost optimization. By tracking function invocation counts and duration, you can identify and fix inefficient code or bugs that are causing an excessive number of executions, which can lead to a significant and unexpected increase in your cloud bill.
What is a "cold start" and why is it important to monitor?
A "cold start" is the delay that occurs when a serverless function is invoked for the first time after a period of inactivity. The cloud provider must initialize the execution environment, which can add a few hundred milliseconds to the response time. Monitoring cold start latency is important because it can directly impact the user experience, especially for user-facing, latency-sensitive applications.
What is the benefit of distributed tracing in a serverless app?
Distributed tracing provides an end-to-end view of a request's journey through a complex, distributed serverless application. It visualizes how different functions, APIs, and services interact to fulfill a request. This is crucial for debugging, as it allows you to pinpoint the exact location of a bottleneck or a failure in the request's flow without having to manually sift through a multitude of different logs from different functions.
How can you get logs from a serverless function?
You can get logs from a serverless function through the cloud provider's native logging service. For example, AWS Lambda automatically pushes all log outputs to Amazon CloudWatch Logs. Teams can then use tools to stream, search, and analyze these logs. It is best practice to use structured logging (e.g., JSON) so that the logs are machine-readable and easy to query and parse.
How do you monitor for throttling in a serverless application?
Throttling occurs when the number of concurrent executions of a function exceeds the configured limit. This is a crucial metric to monitor as it can lead to failed requests. You can monitor throttling by tracking a dedicated metric provided by the cloud vendor (e.g., the `Throttles` metric in AWS CloudWatch) and by setting an alert to be notified when the rate exceeds a certain threshold.
What role does a "single pane of glass" play in serverless monitoring?
A "single pane of glass" refers to a unified dashboard that provides a consolidated view of all your application's metrics, logs, and traces. In serverless, where data is generated by many different, disconnected services, a single pane of glass is essential for providing a holistic view of the system's health, simplifying troubleshooting, and eliminating the need to toggle between different dashboards.
How can you optimize a serverless function based on monitoring data?
You can optimize a function by using monitoring data to identify performance bottlenecks. For instance, if you see high duration times, you might increase the memory allocation, as this often provides more CPU power. If you see high cold start latency, you might use a "provisioned concurrency" setting to keep the function "warm." These decisions are all data-driven and are the essence of a modern optimization practice.
How does serverless monitoring differ from container monitoring?
Container monitoring (e.g., for Docker or Kubernetes) still involves monitoring the health and resource usage of a persistent container host. While the container itself is ephemeral, the underlying host is not. Serverless monitoring is completely abstracted from the host and focuses entirely on the event-driven behavior, invocation count, and duration of individual functions, which are the most relevant metrics in this environment.
Can serverless observability help with security?
Yes, serverless observability can significantly enhance security. By analyzing logs and traces, security teams can detect anomalous behavior, such as unauthorized API calls or unexpected function invocations. Monitoring and alerting on these events can help to identify and respond to security threats in real-time. Logs and traces are also invaluable for conducting a post-mortem security audit.
What is the importance of a low MTTR in serverless?
A low MTTR (Mean Time to Resolution) is crucial in serverless DevOps because it signifies the ability to quickly recover from an incident. The distributed and complex nature of serverless architectures means that a small bug can have cascading effects. By using observability to quickly pinpoint the root cause and automate the fix, teams can dramatically reduce their MTTR and prevent a major outage, thereby ensuring a higher level of service reliability.
How does serverless monitoring impact the developer experience?
Effective serverless monitoring provides developers with immediate, actionable feedback on their code. By providing detailed logs and traces, developers can see exactly how their function performed in a live environment and can debug issues without having to reproduce them locally. This quick feedback loop empowers developers and accelerates the development process, which is a core benefit of a modern DevOps culture.
Are cloud-native monitoring tools sufficient for serverless?
Cloud-native monitoring tools (like CloudWatch) are a great starting point and provide a solid foundation. However, they can be less effective for complex multi-cloud deployments or for organizations that require advanced analytics and cross-service correlation. Many teams choose to supplement cloud-native tools with third-party observability platforms that offer a more unified and advanced "single pane of glass" experience.
What is the best way to get logs from multiple functions?
The best way is to centralize your logs from all your functions into a single, centralized platform. Cloud providers offer this as a service, but you can also use a platform like the Elastic Stack (ELK) to collect, store, and analyze logs from all your functions in one place. This makes searching and troubleshooting across your entire application much more efficient.
How do you monitor asynchronous events in serverless?
Asynchronous events (e.g., events sent to a queue like SQS) are best monitored using distributed tracing. A trace can follow an event from its origin through the queue to the function that consumes it. This allows you to track the end-to-end latency of the entire event-driven flow, which is not possible with traditional log or metric monitoring alone. It provides a complete picture of the application's responsiveness.
How can a team start with serverless monitoring?
A team should start by enabling the native logging and metrics for their functions. From there, they should focus on creating dashboards that display key metrics like invocation count, duration, and error rate. The next step is to introduce distributed tracing to gain an end-to-end view of requests. Finally, they should use this data to set up smart alerts and automated responses for common failure modes.
What is the importance of structured logging in serverless?
Structured logging, where logs are formatted in a machine-readable format like JSON, is essential for serverless. Unlike unstructured text logs, structured logs can be easily ingested, parsed, and queried by automated tools. This allows for powerful analytics, as teams can search and filter logs based on specific fields (e.g., `user_id`, `request_id`, `error_code`), which is a vital part of effective troubleshooting.
What's Your Reaction?
 Like
0
Like
0
 Dislike
0
Dislike
0
 Love
0
Love
0
 Funny
0
Funny
0
 Angry
0
Angry
0
 Sad
0
Sad
0
 Wow
0
Wow
0
![100+ Azure DevOps Interview Questions and Answers [Updated 2025]](https://www.devopstraininginstitute.com/blog/uploads/images/202509/image_140x98_68c40aa9a3834.jpg)


![Future Scope of DevOps Careers in Pune [Updated 2025]](https://www.devopstraininginstitute.com/blog/uploads/images/202510/image_140x98_68e3a84652312.jpg)


