


![Kong Interview Preparation Guide [2025]](https://www.devopstraininginstitute.com/blog/uploads/images/202509/image_430x256_68dbb95326997.jpg)


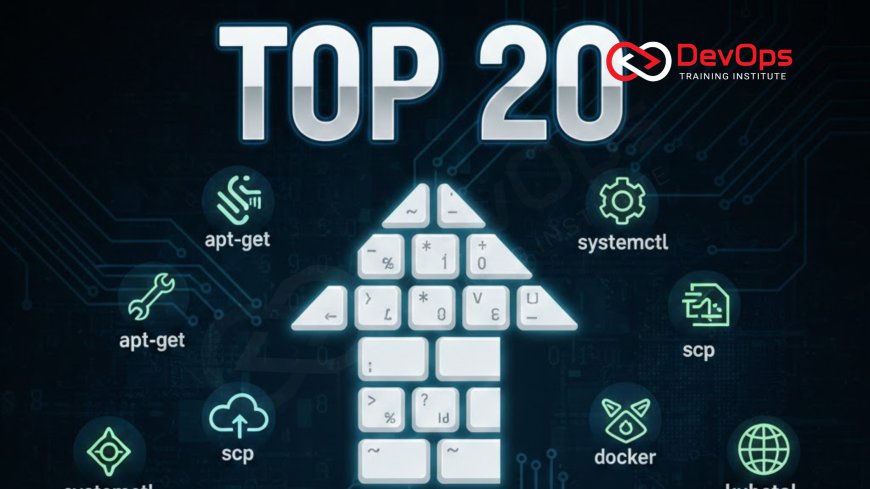
Top 20 Linux Commands for DevOps Engineers
Unlock the power of the Linux terminal with this comprehensive guide to the top 20 commands every DevOps engineer must master in 2025. Designed for beginners, this resource breaks down essential tools like ls, grep, find, tail, and systemctl with practical examples, real-world DevOps scenarios, and step-by-step usage. Whether you are troubleshooting Kubernetes clusters, analyzing CloudWatch logs, automating SQS integrations, or scaling EKS workloads, these commands form the foundation of efficient operations. Learn to navigate file systems, monitor resources, manage processes, and script automation to boost productivity, reduce downtime, and enhance your career. Includes cheat sheets, best practices, and tips for integrating with AWS services like Lambda triggers and RDS monitoring for seamless task processing and performance analysis.
Introduction
The Linux terminal stands as the ultimate playground for DevOps engineers, a place where ideas turn into infrastructure and problems dissolve into solutions with a few keystrokes. In today's fast-paced world of cloud-native applications, container orchestration, and serverless computing, proficiency in core Linux commands is not just a nice-to-have; it is the bedrock upon which reliable systems are built. Whether you are a newcomer dipping your toes into SSH sessions on an EC2 instance or a seasoned professional optimizing EKS clusters for peak performance, these commands empower you to diagnose issues swiftly, automate repetitive tasks, and maintain the high availability that modern businesses demand. This guide explores the top 20 Linux commands, selected based on their frequency of use in daily DevOps workflows, from monitoring CloudWatch metrics to integrating SQS with Lambda for seamless task processing. Each section provides clear explanations, practical examples, and tips tailored for beginners, ensuring you can apply them immediately in real scenarios like scaling RDS databases or analyzing application performance with CloudWatch Logs Insights. By mastering these, you will not only streamline your operations but also gain confidence in handling the complexities of hybrid environments and decoupled microservices.
Understanding the benefits of decoupling services using SQS, for instance, becomes tangible when you use commands to poll queues or trigger events, allowing independent scaling without cascading failures. Similarly, creating CloudWatch alarms to detect failures in EC2 or Lambda invocations relies on logging and querying skills honed through tools like grep and journalctl. As we dive deeper, remember that these commands are more than syntax; they are the language of reliability, enabling you to set up custom CloudWatch dashboards for real-time monitoring or automate responses to events with Lambda triggers. With practice, you will transform from a command-line novice to a terminal virtuoso, ready to tackle any DevOps challenge.
1. ls: Listing Files and Directories Efficiently
The ls command is your gateway to understanding any Linux file system, displaying contents of directories in a structured way that reveals permissions, sizes, and timestamps at a glance. For DevOps engineers, it is indispensable for quick audits of deployment artifacts or configuration files scattered across servers. Imagine logging into an EC2 instance to verify if your latest application bundle uploaded correctly; ls lets you spot issues before they escalate. Its simplicity belies its power, making it a daily staple for navigating Kubernetes pod volumes or S3-synced directories.
- Use ls -l to view detailed listings, showing ownership and modification dates crucial for compliance checks in regulated environments.
- ls -a reveals hidden files like .env or .gitignore, often overlooked sources of configuration errors in CI/CD pipelines.
- Combine with ls -lh for human-readable sizes, helping identify bloated logs that could fill up RDS storage quotas unexpectedly.
- ls -R recursively lists subdirectories, perfect for scanning entire project trees before zipping for Lambda deployments.
- ls --sort=size prioritizes large files, aiding in disk space investigations on EKS worker nodes.
- ls -t sorts by time, useful for reviewing recent changes in /var/log during post-mortem analyses.
Best practice: Create aliases in your .bashrc file, such as alias ll='ls -lah', to streamline repetitive inspections. This habit not only saves time but also builds familiarity with file structures in dynamic environments like those managed by EKS, where rapid iterations demand constant verification.
Common Pitfalls and Tips
Beginners often forget the -a flag, missing critical dotfiles that store secrets or custom configs. Always pair ls with pwd to confirm your location, especially when jumping between EC2 instances via SSH. For advanced use, pipe ls output to grep, like ls -l | grep .yaml, to filter Kubernetes manifests quickly.
2. cd and pwd: Mastering Directory Navigation
Navigating the file system with cd (change directory) and pwd (print working directory) forms the core of efficient terminal work, preventing the disorientation that plagues new users in sprawling server environments. In DevOps, where you might switch between /etc for system configs and ~/projects for codebases multiple times an hour, these commands ensure you stay oriented without wasting cycles on lost paths. Pwd is your compass, confirming you are in the right spot before running destructive operations like rm or terraform apply.
- cd .. moves up one level, essential for backing out of deep log directories during troubleshooting.
- cd - returns to the previous directory, a lifesaver when toggling between app and infra folders.
- cd ~ jumps to home, where personal scripts and .aws configs reside for seamless CLI sessions.
- pwd -P resolves symbolic links, avoiding confusion in mounted volumes on EKS nodes.
- Use cd /path/to/dir && pwd to chain and verify in scripts, reducing errors in automation.
- pushd /dir1; pushd /dir2; popd returns sequentially, ideal for temporary explorations.
For beginners, integrate pwd into your workflow by aliasing cd='cd && pwd' to always echo your new location. This practice is particularly valuable when managing decoupled services, where SQS queues might trigger Lambda functions from various directories, ensuring you apply changes in the correct context.
In practice, during a deployment to an EC2 fleet, you might cd /opt/app, pwd to confirm, then ls to inspect binaries, creating a rhythmic flow that minimizes mistakes and accelerates task processing.
Advanced Navigation Techniques
Leverage tab completion after typing cd / to speed up paths, and explore zoxide or autojump for fuzzy matching in large repos. These enhancements turn navigation into a superpower for handling complex EKS deployments.
3. grep: The Search and Filter Powerhouse
Grep, short for global regular expression print, is the Swiss Army knife of text searching, indispensable for sifting through logs, configs, and outputs in voluminous DevOps datasets. Whether hunting for error patterns in CloudWatch-exported logs or validating SQS message payloads, grep's regex capabilities allow precise filtering that saves hours of manual scrolling. Its speed and versatility make it a go-to for real-time analysis, turning raw data into actionable insights with minimal effort.
- grep "ERROR" /var/log/app.log identifies failures instantly, crucial for Lambda invocation troubleshooting.
- grep -r "api_key" . scans entire directories for sensitive data leaks before commits.
- grep -i "failed" --color=auto highlights case-insensitive matches for quick visual scans.
- grep -v "healthy" excludes noise, focusing on anomalies in RDS query logs.
- grep -A 3 -B 3 "timeout" shows context around issues, aiding root cause in EKS pod crashes.
- egrep for extended regex, like egrep "(GET|POST) /api/v1" access.log for endpoint stats.
Integrate grep with pipes for power: journalctl | grep "OOMKilled" to spot memory issues on EC2 instances. For beginners, start with simple patterns and graduate to regex for advanced filtering, such as validating JSON responses from SQS integrations.
One common use case is monitoring application performance: tail -f logs | grep "duration > 500ms" to flag slow requests, directly tying into CloudWatch Logs Insights for deeper analysis.
Grep Regex Basics
Learn ^ for start of line, $ for end, and . for any character to craft precise queries. Tools like regex101.com help practice without risking production data.
4. find: Locating Files with Precision
The find command searches the file system hierarchically, based on name, type, size, or modification time, making it vital for cleanup, backups, and security audits in DevOps pipelines. Unlike locate, which relies on a database, find scans live, ensuring accuracy in dynamic environments like containerized apps where files change frequently.
- find /var -name ".pid" -delete removes stale process files post-deployment.
- find . -type d -empty -delete cleans empty directories after migrations.
- find /logs -mtime +30 -exec gzip {} \; compresses old logs automatically.
- find /etc -perm -4000 -ls lists SUID binaries for security reviews.
- find . -size +1G -print to spot large files bloating EKS volumes.
- find /app -path "/.git" -prune -o -name ".jar" -print skips repos for JAR hunts.
Pair with xargs for batch operations: find . -name ".log" | xargs head -5 to preview multiple logs. In DevOps, find shines during secure migrations to S3, locating and archiving datasets efficiently.
For performance, limit depth with -maxdepth 3 to avoid full system scans on large servers, preserving resources during peak hours.
Safety First with Find
Always test with -print before -delete or -exec to preview actions, preventing accidental data loss in production RDS backups or Lambda code dirs.
5. tail: Real-Time Log Tailoring
Tail displays the end of files, with -f for following new content, making it the command of choice for live debugging in DevOps. From watching Nginx access logs during load tests to monitoring Lambda executions, tail provides the immediacy needed for reactive operations.
- tail -f /var/log/auth.log tracks login attempts in real time.
- tail -n 500 error.log | less for paginated recent errors.
- tail -f app.log --pid=1234 follows only while process 1234 runs.
- multitail -cS app /var/log/syslog for colored, multi-file viewing.
- tail -f access.log | awk '{print $7}' | sort | uniq -c for top endpoints.
- tail -q -f .log merges multiple logs without headers.
Use tail with tee to log sessions: tail -f log | tee session.txt for auditable troubleshooting. In decoupled SQS services, tail helps verify message processing without console dives.
Beginners: Ctrl+C stops following; combine with grep for filtered tails to focus on anomalies like 5xx errors in RDS connections.
Alternatives for Advanced Users
Consider lnav for log navigation or goaccess for web log analysis, building on tail's foundation for deeper insights.
6. ps and top: Process Management Fundamentals
Ps lists processes, while top provides interactive monitoring; together, they help identify resource hogs, zombie processes, or rogue apps in busy servers. Essential for optimizing EC2 costs or diagnosing Lambda cold starts.
- ps aux | grep nginx shows all Nginx processes with resource use.
- ps -ef --forest trees parent-child relationships for debug.
- top -p 1234 monitors specific PID interactively.
- ps -eo pid,ppid,cmd,%cpu,%mem --sort=-%cpu top CPU users.
- top -b -n1 > processes.txt for scripted snapshots.
- pstree -p visualizes process hierarchy like a family tree.
Shift+i in top inverts sort; use htop if available for mouse-friendly views. These commands shine in CloudWatch alarm setups, correlating process metrics with system health.
For teams, script ps outputs to CloudWatch for custom dashboards, enabling proactive scaling of EKS nodes based on load.
From List to Kill
Once identified, use kill -15 PID for graceful stops; escalate to -9 only if necessary to avoid data corruption.
7. df and du: Disk Space Detectives
Df reports file system disk space, du estimates usage; they are lifesavers when servers grind to a halt from full disks, common in log-heavy environments or during bulk S3 syncs.
- df -hT shows usage with file system types in human terms.
- du -sh /var/log/ summarizes log directory sizes.
- df -i checks inode exhaustion from many small files.
- du -d1 -h . | sort -hr ranks top space consumers.
- ncdu /var for interactive drill-down (install if needed).
- df --output=source,target,size,used,pcent / to focus on percentages.
Alert at 80% full; use these in cron jobs to email warnings. In DevOps, they prevent failures in custom CloudWatch dashboards by tracking storage trends.
Pro tip: du --exclude=/proc avoids misleading kernel data; pair with find -size +100M for cleanup targets.
Preventing Full Disks
Schedule log rotation with logrotate.conf and monitor via CloudWatch to catch issues before they impact RDS writes or Lambda executions.
8. curl: API Testing and Data Fetching
Curl transfers data via URLs, excelling at HTTP requests for testing endpoints, downloading configs, or validating integrations like SQS polls.
- curl -s -o output.json https://api.example.com/data silent download.
- curl -H "Content-Type: application/json" -d '{"key":"value"}' POST API.
- curl -w "%{http_code}\n" checks response codes only.
- curl -L follows redirects for chained APIs.
- curl --connect-timeout 5 prevents hanging requests.
- curl -u user:pass https://protected.site basic auth test.
Use in scripts for health checks: curl -f http://localhost:8080 || echo "Down". For CloudWatch Logs Insights, curl fetches JSON for query validation.
Beginners: -v for verbose mode reveals headers; httpie is a user-friendly alternative.
Curl in CI/CD
Integrate curl in Jenkins pipelines to test webhook endpoints, ensuring SQS-to-Lambda flows work pre-deploy.
9. ssh: Secure Remote Operations
SSH provides encrypted remote access, key for managing fleets of EC2 or EKS nodes without exposing credentials.
- ssh -i ~/.ssh/id_rsa user@ec2-instance connect with key.
- ssh -p 2222 non-standard port for security.
- ssh -o StrictHostKeyChecking=no quick connects (use cautiously).
- ssh-copy-id user@host automates key setup.
- ssh -L 8080:localhost:80 port forwarding for local testing.
- ssh -J bastion target multi-hop for private subnets.
Configure ~/.ssh/config for aliases: Host prod HostName ip User ec2-user IdentityFile key.pem. Essential for EC2 monitoring, SSH into instances for deep dives.
Security: Disable password auth in sshd_config; use mosh for mobile-friendly sessions.
SSH Keys Best Practices
Rotate keys quarterly; use ed25519 for stronger crypto, integrating with IAM roles for EKS access.
10. systemctl: Modern Service Control
Systemctl manages systemd units, from starting Nginx to enabling auto-boot services on Ubuntu/CentOS servers.
- systemctl status docker checks container runtime health.
- systemctl restart kubelet refreshes Kubernetes agent.
- systemctl enable nginx at boot persistence.
- systemctl list-units --type=service active services overview.
- systemctl mask badservice disables permanently.
- systemctl daemon-reload after config changes.
Journalctl -u service for logs; vital for Lambda trigger setups on EC2 hosts.
For beginners, systemctl is --user for personal services; mask prevents accidental starts.
Troubleshooting Services
Use systemctl show unit for details; reload after edits to avoid restarts.
Conclusion
These 20 Linux commands represent the distilled essence of DevOps terminal mastery, tools that bridge the gap between code and infrastructure in ways no GUI ever could. From the humble ls revealing hidden configs to the mighty grep unearthing errors in petabytes of logs, each one equips you to handle the chaos of production with grace and speed. As you integrate them into your daily routine—whether polling SQS queues, setting CloudWatch alarms for EKS failures, or automating Lambda responses to RDS alerts—you will notice a profound shift: problems become puzzles, outages opportunities, and your career trajectory upward. Remember, the terminal rewards persistence; practice these in sandboxes, scripts, and real incidents, and soon they will feel like extensions of your thoughts. In the evolving landscape of AWS services and Kubernetes orchestration, these commands remain timeless, ensuring you not only survive but thrive as a DevOps engineer.
Frequently Asked Questions
What is the most important Linux command for beginners?
ls, because it gives you immediate visibility into your environment and builds confidence quickly.
How can I practice these commands safely?
Use a local VM or cloud sandbox like AWS Lightsail to experiment without risking production.
Are these commands the same on macOS?
Mostly yes, but macOS uses BSD variants; install GNU coreutils for full compatibility.
What if I forget a flag?
Use man command (e.g., man grep) for manuals or tldr for concise examples.
Can I script these for automation?
Absolutely; wrap in Bash scripts and run via crontab for scheduled tasks.
How do they integrate with AWS?
Many, like curl and ssh, are used in AWS CLI workflows for EC2 and S3 operations.
Is there a mobile app for these?
Termux on Android or iSH on iOS simulate Linux terminals for on-the-go practice.
What about Windows?
WSL2 provides a full Linux environment inside Windows for seamless use.
Do I need root for all commands?
No; sudo elevates when needed, but follow least privilege principles.
How long to master them?
Daily use for a month turns them into habits; advanced combos take longer.
Are there GUI alternatives?
Yes, like FileZilla for scp or htop web UIs, but terminal is fastest for pros.
What if my distro differs?
Core commands are universal; check apt/yum for variants like net-tools vs iproute2.
Can I alias dangerous commands?
Aliases for safety, like rm='rm -i' to prompt before deletes.
How do they help in Kubernetes?
Exec into pods with kubectl exec and use these for debugging inside containers.
Final advice for learners?
Copy-paste examples into a playground daily; real incidents cement learning.
What's Your Reaction?
 Like
0
Like
0
 Dislike
0
Dislike
0
 Love
0
Love
0
 Funny
0
Funny
0
 Angry
0
Angry
0
 Sad
0
Sad
0
 Wow
0
Wow
0
![100+ Azure DevOps Interview Questions and Answers [Updated 2025]](https://www.devopstraininginstitute.com/blog/uploads/images/202509/image_140x98_68c40aa9a3834.jpg)


![Future Scope of DevOps Careers in Pune [Updated 2025]](https://www.devopstraininginstitute.com/blog/uploads/images/202510/image_140x98_68e3a84652312.jpg)


