Top 20 Tools for Continuous Monitoring & Analysis
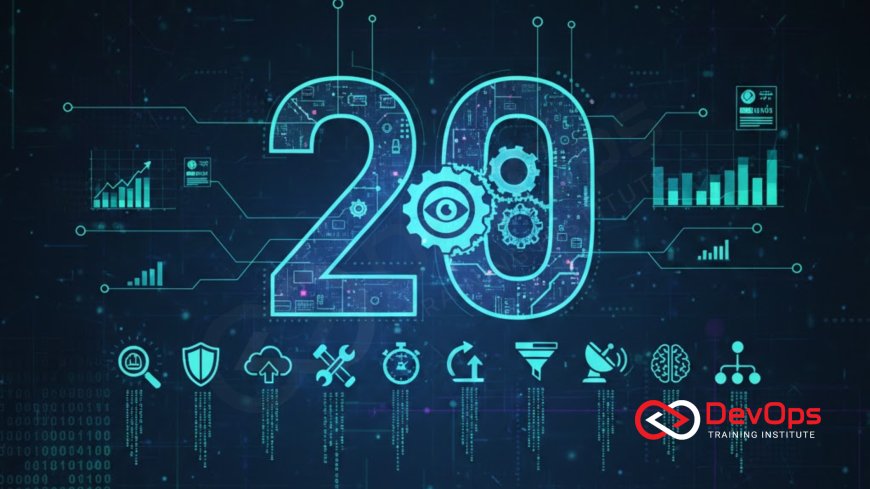
Achieving operational excellence in the cloud requires mastery over continuous monitoring and analysis, driven by a powerful suite of specialized tools. Explore the top 20 essential platforms and open-source solutions used by modern DevOps and SRE teams, covering everything from core metrics and logging to advanced tracing and incident response. This comprehensive guide details platforms like Prometheus, Splunk, Datadog, and the Elastic Stack, demonstrating how they enable full-stack visibility, proactive anomaly detection, and unified observability, drastically reducing MTTR and ensuring service reliability across complex microservices and hybrid environments.
Introduction: The Observability Imperative
In the era of cloud-native computing, where applications are constructed from hundreds of ephemeral microservices and deployed across dynamic infrastructure, continuous monitoring and analysis have evolved from a simple operational requirement into a fundamental architectural imperative. The sheer complexity and velocity of change in these environments generate an overwhelming volume of telemetry data—metrics, logs, and traces—which, if not managed and correlated effectively, create critical blind spots that lead to catastrophic outages and slow incident response. The goal of continuous monitoring is not just to alert on failure, but to maintain a full, real-time understanding of the system's internal state, ensuring that stability is an engineered outcome rather than a manual expectation. This requires adopting a unified strategy that goes beyond fragmented tools and addresses the need for centralized, intelligent data analysis.
Selecting the right toolkit is the most significant step in establishing this continuous feedback loop, which is essential for any high-performing DevOps team. The tools must be capable of massive horizontal scalability, deep integration with container orchestration platforms like Kubernetes, and be flexible enough to handle heterogeneous, multi-cloud data sources. The landscape of monitoring and analysis has diversified into distinct categories, encompassing everything from foundational open-source metric collectors to sophisticated, AI-driven commercial observability platforms. By leveraging these specialized tools, organizations can transform their operational posture, ensuring they can not only react quickly to failures but also predict and prevent them proactively before they impact the end-user experience, moving the engineering team from reactive troubleshooting to proactive stability management.
This comprehensive guide details the top 20 tools utilized by leading technology companies today, categorized by their primary function within the observability pipeline. Mastering this toolkit provides the necessary foundation for achieving full-stack visibility, enabling faster root cause analysis (RCA), improving capacity planning, and significantly reducing the financially damaging Mean Time to Resolution (MTTR).
Open Source Foundation: Metrics and Visualization
Open-source tools form the technical backbone of many modern monitoring strategies, offering flexibility, community support, and the ability to customize and scale solutions without proprietary vendor lock-in. These tools are favored by cloud-native organizations that operate large Kubernetes environments and prioritize deep control over their data collection and storage infrastructure. The combination of a dedicated metric database with a powerful visualization layer has become the standard starting point for many SRE teams building their observability stack.
The strength of the open-source community is evident in these foundational tools:
1. Prometheus: The industry-standard open-source monitoring and alerting toolkit designed specifically for reliability and scalability in distributed systems. Prometheus excels at collecting and storing time-series data using its pull-based data collection model and powerful query language, PromQL. It is the metric engine of choice for nearly all Kubernetes environments due to its native integrations and its design as part of the Cloud Native Computing Foundation (CNCF).
2. Grafana: An open-source analytics and monitoring solution that serves as the premier visualization layer for metrics data. Grafana allows engineers to query, visualize, and understand metrics across multiple sources (including Prometheus, InfluxDB, and Elasticsearch) through customizable, interactive dashboards. Its rich ecosystem of plugins and flexible dashboarding capabilities make it indispensable for presenting complex system health and performance data clearly.
3. OpenTelemetry (OTel): An increasingly critical component, OpenTelemetry is an open-source project that provides a standardized set of APIs, libraries, and agents for instrumenting, generating, collecting, and exporting telemetry data (metrics, logs, and traces) from applications. Its vendor-agnostic approach ensures that teams can easily switch monitoring backends or combine tools without modifying application code, future-proofing the instrumentation process and unifying data collection.
4. InfluxDB: A high-performance, purpose-built time-series database designed for metrics and events. InfluxDB is often used as an alternative or complement to Prometheus, offering strong capabilities for handling massive volumes of time-stamped data generated by sensors, applications, and infrastructure at the high ingestion rates required by large-scale cloud applications.
Centralized Logging and Analysis Engines
Logs provide the essential, granular context necessary for root cause analysis (RCA) and security forensics, recording every event and state change within the application and infrastructure. In dynamic cloud environments, logs must be collected reliably before ephemeral containers are terminated, standardized for searching, and stored in a scalable engine for analysis. These tools form the logging backbone of enterprise observability, handling massive data volumes and complex search queries required for deep investigation.
5. Elasticsearch, 6. Logstash, 7. Kibana (The Elastic Stack): This trio (often referred to as the ELK Stack) is the most widely adopted open-source solution for centralized logging. Elasticsearch provides the distributed search and analytics engine for storing and querying logs. Logstash acts as the data processing pipeline, collecting, enriching, and transforming logs before ingestion. Kibana is the visualization layer, offering a web interface for complex log querying and dashboard creation. This modular architecture offers maximum flexibility and control over the log data lifecycle, a key requirement for compliance and auditability in regulated industries.
8. Fluentd and 9. Fluent Bit: These are CNCF-graduated projects providing the lightweight, essential components for cloud-native log collection. Fluentd serves as a unified logging layer, collecting and routing logs with high flexibility via 500+ plugins. Fluent Bit is the extremely lightweight, high-performance forwarder optimized specifically for low-resource environments like Kubernetes and edge devices. Both ensure logs are reliably transported off the host machine and into the centralized storage engine before a container or Pod is destroyed, guaranteeing data integrity in transient environments.
Commercial All-in-One Observability Platforms
For organizations prioritizing speed of implementation, ease of management, and unified visibility, commercial, all-in-one platforms provide solutions that integrate metrics, logs, and traces into a single platform with advanced features like AI-driven anomaly detection and out-of-the-box integrations. While proprietary and often costlier, they eliminate the operational burden of managing and scaling a self-hosted, open-source stack, allowing engineering teams to focus purely on application delivery.
10. Datadog: A cloud-based platform offering comprehensive observability, security, and log management across the full stack. Datadog is favored for its intuitive interface, vast array of ready-to-use integrations (over 500), and its unique ability to correlate metrics, logs, and traces automatically, significantly accelerating root cause analysis. Its real-time capabilities and AI-driven anomaly detection make it a powerful choice for high-velocity, cloud-native environments that need immediate, actionable insights.
11. Splunk: A veteran enterprise platform specializing in collecting, indexing, and analyzing massive volumes of machine-generated data, particularly logs. Splunk's powerful Search Processing Language (SPL) and deep forensic capabilities make it the tool of choice for complex security monitoring (SIEM) and regulatory compliance. The Splunk Observability Cloud now integrates metrics and tracing, providing a full-stack solution, but its core strength remains its ability to provide deep, customizable analysis across immense log datasets.
12. Dynatrace: An advanced, AI-driven observability platform designed for complex, dynamic environments. Dynatrace distinguishes itself with automatic application discovery, continuous code-level analysis, and a proprietary AI engine (Davis) that performs automated root cause analysis, reducing alert noise and providing precise, pre-analyzed answers to performance issues. Its focus on automation and context makes it highly popular for large enterprises seeking to manage complexity with minimal manual configuration.
13. New Relic: A modern, full-stack observability platform that provides deep insights into user experience and application performance. New Relic offers extensive language support and robust features for distributed tracing, APM (Application Performance Monitoring), and infrastructure monitoring, all unified in a visually stunning interface. It is often chosen by organizations looking for a unified, managed solution that strongly emphasizes the end-user experience and developer-centric data visualization.
Core Monitoring Tools Comparison Table
The choice between open-source and commercial solutions depends heavily on the organization's budget, in-house operational skills, and the complexity of their multi-cloud or hybrid environment. The comparison below highlights the primary trade-offs between key market leaders across different categories of the observability stack.
| # | Tool Name | Category | Key Strength / Focus | Deployment Model |
|---|---|---|---|---|
| 1 | Prometheus | Open Source Metrics | CNCF standard for time-series data; Kubernetes-native metric collection. | Self-Hosted / Cloud |
| 8 | Datadog | Commercial Full-Stack | Unified platform with 500+ integrations; excellent correlation and ease of use. | SaaS (Cloud-Based) |
| 9 | Splunk | Log Analytics / SIEM | Unmatched forensic search capabilities on massive log data volumes and security analysis. | SaaS / Self-Hosted |
| 15 | Zabbix | Open Source Infrastructure | Robust, enterprise-class monitoring for millions of metrics from traditional servers and networks. | Self-Hosted / Agent-Based |
| 17 | AppDynamics | Application Performance Monitoring (APM) | Deep, code-level visibility into application performance and business transactions. | SaaS / Self-Hosted |
Enterprise APM and Log Analytics Platforms
Application Performance Monitoring (APM) tools provide specialized, code-level insight into the performance of the application itself, moving beyond infrastructure health. Log Analytics platforms, meanwhile, are designed for extreme-scale data handling and complex forensic search required for auditing and advanced security intelligence. These tools are critical in environments where the focus is on optimizing application business logic and ensuring deep compliance by analyzing massive, heterogeneous data sets, often across hybrid or multi-cloud infrastructure where data sources can be unpredictable.
14. Sumo Logic: A unified logs and metrics platform that specializes in cloud-native and multi-cloud observability and security monitoring. Sumo Logic leverages machine learning to automate analysis, providing deep insights into microservices performance and security threats from a single platform. Its strength lies in handling immense data volumes and performing real-time security analytics (cloud SIEM) across distributed systems, offering a strong combined platform for both operations and security teams.
15. LogicMonitor: Designed for broad visibility across infrastructure, applications, and services, LogicMonitor specializes in agentless monitoring for hybrid environments. It combines logs, metrics, and alerting into a streamlined platform with strong out-of-the-box monitoring for thousands of devices and applications. Its particular focus on ease of deployment and unified dashboards makes it popular for managing complex legacy systems alongside modern cloud infrastructure.
16. Graylog: A high-performance, open-source log management and analysis platform that stands out for its speed and user-friendly log exploration features. Built on a multi-component architecture, Graylog provides enterprise-grade features for centralized log collection, security monitoring (SIEM), and compliance auditing. It offers a powerful alternative to the ELK Stack for organizations seeking high-speed log search and robust security features within a self-managed environment, supporting hybrid teams effectively.
Legacy and Infrastructure Monitoring Giants
These tools represent the classic, agent-based approach to monitoring, originating from the need to track traditional servers, networks, and operating systems. While often seen as "legacy," they remain dominant in hybrid cloud environments, critical infrastructure, and regulated industries that require continuous, agent-based monitoring of physical hardware, network devices, and operating system health with granular control over checks and alerts. They offer high stability and extensive customization capabilities for infrastructure monitoring.
17. Nagios: One of the oldest and most trusted open-source monitoring systems, Nagios specializes in tracking the health of IT infrastructure, networks, and services. Known for its stability and extensive plugin system, it is frequently used by organizations that require granular control over host and service checks, providing essential proactive detection of network issues before they affect critical processes. Its core strength lies in its ability to monitor traditional Linux and network services reliably.
18. Zabbix: An enterprise-class, open-source monitoring solution designed to monitor millions of metrics collected from servers, network devices, and virtual machines. Zabbix is renowned for its robustness and scalability, offering distributed monitoring with centralized web management, advanced problem detection, and auto-discovery of network devices and services, making it a feature-rich alternative to Nagios for large-scale infrastructure monitoring.
19. Sensu: A simple, scalable, and event-driven monitoring framework designed for modern infrastructure. Sensu focuses on automated monitoring of infrastructure, applications, and business KPIs using a dynamic, flexible architecture that is well-suited for containerized and cloud environments. Its ability to integrate with various data sources and monitoring tools makes it a valuable, modern open-source tool for scalable infrastructure visibility.
Incident Response and Next-Gen Solutions
The final components of the continuous monitoring pipeline are tools dedicated to incident management and next-generation solutions that integrate AI/ML for smarter analysis. These tools ensure that when monitoring systems detect a problem, the right team is notified immediately, the data is enriched with context, and the response is rapid, transforming alerts into actionable incidents that drive down MTTR.
20. PagerDuty / Opsgenie (Incident Management): These are not monitoring tools but critical incident management platforms that ingest alerts from all the tools listed above (Prometheus, Datadog, Zabbix) and route them intelligently to the appropriate on-call personnel based on time, urgency, and rotation. Their robust alerting, escalation policies, and integration capabilities are essential for streamlining responses to unexpected outages and ensuring that the operational team is always prepared for failure, significantly improving incident resolution time.
21. SigNoz: A newer, open-source unified observability platform that aims to combine metrics, logs, and distributed tracing into a single application, directly challenging the complexity and cost of the fragmented ELK + Prometheus stack. SigNoz leverages OpenTelemetry for native data ingestion, providing a powerful, cost-effective alternative for cloud-native teams seeking unified visibility and a simplified deployment model for their entire observability pipeline.
Integrating Network Health and Security Monitoring
The effectiveness of monitoring in distributed systems relies heavily on the health and security of the underlying network. Engineers must be able to correlate application performance issues (Layer 7) with network failures (Layer 3/4). Security monitoring, for example, requires strict control over all communication endpoints. Best practices for monitoring and securing cloud networking demand that engineers understand the essential ports and protocols used for internal service communication and external access.
Furthermore, tracing application transactions across the network often involves understanding low-level packet flow. For instance, in virtualized environments, network visibility is abstracted, making it difficult to debug if the issue lies in the cloud provider's network routing or the application's configuration. This requires a strong foundational knowledge of networking, including the distinction between Layer 3 and Layer 4 protocols for traffic management, to correctly interpret metrics from virtual network interfaces. Traditional network monitoring principles remain relevant, even though the infrastructure is software-defined. For example, understanding how network packets traverse a simple local area network is still the basis for diagnosing connectivity issues in a VPC subnet, as all networking fundamentally relies on these core concepts.
Securing the continuous monitoring infrastructure itself is paramount. This involves applying best practices for hardening the endpoints and ensuring secure remote server access for monitoring agents. Tools like Nagios or Zabbix often rely on agents running on remote servers, which means ensuring that all agents and central servers follow strict guidelines for hardening TCP and UDP services and preventing unauthorized access or data exfiltration. This integration of network security and application observability is the essence of a modern DevSecOps approach to operational resilience, providing 360-degree visibility.
Conclusion: Achieving Full-Stack Visibility
The journey toward full-stack visibility requires more than just collecting data; it requires transforming that data into actionable intelligence through specialized and integrated tools. The 20 platforms and open-source solutions detailed here provide the necessary coverage across metrics, logging, tracing, APM, and incident management, allowing DevOps and SRE teams to engineer reliability proactively. Whether an organization chooses the flexible, customizable power of the open-source ELK Stack and Prometheus, or the streamlined, AI-powered convenience of commercial platforms like Datadog or Dynatrace, the goal remains the same: eliminating monitoring blind spots and drastically reducing MTTR.
Ultimately, the best monitoring strategy is one that is unified and context-aware, capable of correlating application behavior with the health of the underlying infrastructure and network. By treating continuous monitoring as a core architectural necessity and mastering these specialized tools, organizations ensure that their software delivery pipelines operate safely and efficiently, guaranteeing service resilience and the ability to innovate continuously in the demanding cloud-native era.
Frequently Asked Questions
What is the primary role of Prometheus in a monitoring stack?
Prometheus is the engine for collecting, storing, and querying time-series metric data, primarily used for alerting and tracking system health over time.
How does distributed tracing help microservices?
Tracing visualizes the request's journey across multiple services, pinpointing latency bottlenecks and revealing complex dependencies that metrics cannot show.
What is the biggest advantage of using Datadog?
The biggest advantage is its unified platform, which automatically correlates metrics, logs, and traces, simplifying troubleshooting and reducing context switching.
Why are Fluentd and Fluent Bit essential in Kubernetes?
They are essential for reliably collecting logs before ephemeral containers are destroyed, ensuring data integrity in high-velocity, transient environments.
What is the core function of the Elastic Stack (ELK)?
The core function is providing a scalable, centralized platform for processing, storing, and analyzing massive volumes of unstructured and structured log data.
How does PagerDuty integrate with monitoring?
PagerDuty ingests raw alerts from monitoring tools and applies escalation rules to notify the correct on-call team members based on urgency and schedule.
What is APM and what do tools like New Relic provide?
APM (Application Performance Monitoring) provides deep, code-level visibility into the performance of the application logic and business transactions.
Why should DevOps understand the differences in cloud networking?
Understanding cloud networking helps diagnose issues because traffic routing and security are handled by software-defined networks, not physical hardware.
What distinguishes Dynatrace's approach?
Dynatrace uses proprietary AI (Davis) to perform automated root cause analysis and discover application topology, minimizing manual configuration and analysis.
How do OpenTelemetry tools help?
OpenTelemetry provides standardized instrumentation APIs, allowing teams to collect telemetry data once and export it to various vendor or open-source backends.
What is the primary use case for Splunk's powerful search language?
Its powerful search language (SPL) is primarily used for complex forensic analysis, security auditing, and compliance monitoring across massive datasets.
How does Grafana use Prometheus data?
Grafana uses Prometheus as a data source to generate rich, customizable, and interactive dashboards, turning raw time-series data into clear visualizations.
Why must monitoring tools be used to identify unique hardware identifier issues?
Monitoring tools must track unique identifiers (like MAC addresses in some contexts) to trace Layer 2/3 dependencies, which is crucial for networking components.
What is the purpose of Logstash in the ELK Stack?
Logstash is the data processing pipeline that ingests, filters, enriches, and transforms raw logs into a standardized format before sending them to Elasticsearch.
What is the main function of legacy tools like Nagios and Zabbix?
Their main function is robust, agent-based infrastructure monitoring, tracking the health and performance of traditional servers and network devices reliably.
What's Your Reaction?
 Like
0
 Dislike
0
 Love
0
 Funny
0
 Angry
0
 Sad
0
Sad
0
 Wow
0
Wow
0


![Kong Interview Preparation Guide [2025]](https://www.devopstraininginstitute.com/blog/uploads/images/202509/image_430x256_68dbb95326997.jpg)


![100+ Azure DevOps Interview Questions and Answers [Updated 2025]](https://www.devopstraininginstitute.com/blog/uploads/images/202509/image_140x98_68c40aa9a3834.jpg)


![90+ Git and GitHub Interview Questions [2025]](https://www.devopstraininginstitute.com/blog/uploads/images/202509/image_140x98_68c40a7931d60.jpg)


![Future Scope of DevOps Careers in Pune [Updated 2025]](https://www.devopstraininginstitute.com/blog/uploads/images/202510/image_140x98_68e3a84652312.jpg)


