


![Kong Interview Preparation Guide [2025]](https://www.devopstraininginstitute.com/blog/uploads/images/202509/image_430x256_68dbb95326997.jpg)


12 DevOps SLA Monitoring Tools for Production
Ensure your engineering organization meets its service commitments with our detailed guide to the twelve best DevOps SLA monitoring tools for production in twenty twenty six. In an era where downtime costs thousands of dollars per minute, having a robust strategy for tracking Service Level Agreements is non negotiable for maintaining customer trust and operational stability. This comprehensive analysis covers top tier platforms such as Datadog, Dynatrace, and New Relic, alongside powerful open source solutions like Prometheus and Grafana. Learn how to automate error budget tracking, set up intelligent alerting, and visualize real time service health to prevent violations before they occur. Elevate your production monitoring today with expert insights into the tools that power the world's most reliable digital services.
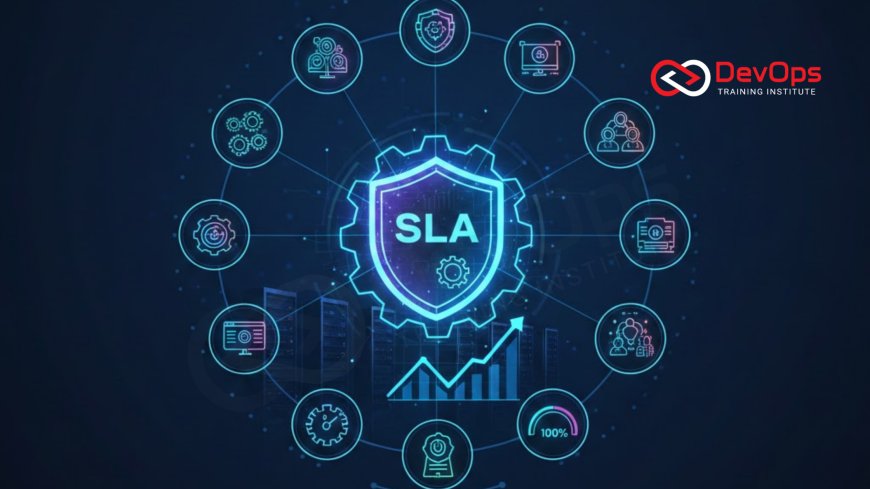
Introduction to SLA Monitoring in Production
Service Level Agreements are the formal promises made to customers regarding the reliability, availability, and performance of a digital service. In a modern production environment, keeping these promises requires more than just luck; it demands a sophisticated monitoring strategy that provides constant visibility into system health. SLA monitoring is the practice of tracking specific performance indicators to ensure they remain within the agreed upon boundaries. For DevOps teams, this means moving beyond simple uptime checks to a holistic view of the user experience across all services and infrastructure components in twenty twenty six.
The transition from reactive to proactive monitoring is essential for any high growth organization. By utilizing specialized tools, teams can identify trending issues that might lead to an SLA violation long before the actual failure occurs. This proactive stance not only protects the company from financial penalties and legal disputes but also significantly enhances the overall quality of the software. Understanding the relationship between Service Level Indicators and the overarching business objectives is a key skill for modern engineers. It is about creating a data driven culture where every technical metric is mapped back to the value delivered to the end user.
The Vital Role of Error Budgets and SLOs
In the world of Site Reliability Engineering, the concept of an error budget is fundamental to balancing innovation with stability. An error budget is the maximum amount of downtime or failure that a service can tolerate within a specific period while still meeting its SLA. If a team has a 99.9% uptime goal, they have a 0.1% error budget to "spend" on new feature releases or risky deployments. Monitoring tools that track these budgets in real time allow teams to make informed decisions about whether to push a new update or focus on improving the stability of the existing production environment.
Service Level Objectives serve as the internal targets that help teams achieve their external SLAs. For example, if the public SLA is 99.5% availability, the internal SLO might be set at 99.9% to provide a safety margin. Modern observability tools automate the calculation of these objectives by aggregating millions of data points across the stack. This automated approach eliminates the guesswork and manual spreadsheets that often lead to inaccurate reporting. By visualizing these objectives alongside incident handling data, teams can gain a clear understanding of where their systems are most vulnerable and prioritize their engineering efforts accordingly for maximum impact.
Synthetics and Real User Monitoring for SLAs
To accurately monitor an SLA, you must see the system from the perspective of the user. Synthetic monitoring involves using scripts to simulate user interactions from various global locations at regular intervals. These "canary" tests check if the critical paths of your application—such as logging in or completing a purchase—are functioning as expected. This provides a consistent baseline of performance that is independent of actual user traffic, allowing you to detect outages even during low volume periods. It is an essential component for any release strategies that aim for zero downtime in production.
Real User Monitoring, on the other hand, captures the actual experience of every person visiting your site in real time. It records metrics like page load speed, JavaScript errors, and network latency directly from the user's browser or mobile device. While synthetics provide consistency, RUM provides the messy, real world data that reveals how your application performs across different devices and network conditions. Combining these two perspectives gives DevOps teams a 360 degree view of their service health. This level of detail is necessary to prove compliance with complex SLAs that include performance targets beyond simple server availability, ensuring that continuous verification is a reality throughout the user journey.
Centralizing Visibility with Unified Dashboards
One of the biggest challenges in production monitoring is the fragmentation of data across dozens of different tools and services. To effectively monitor SLAs, teams must centralize their metrics, logs, and traces into a single source of truth. Unified dashboards allow engineers to correlate a spike in database latency with a drop in frontend performance, making it much easier to identify the root cause of an issue. This centralization is a core requirement for driving cultural change within an organization, as it breaks down silos and ensures that everyone is looking at the same objective data when evaluating service health.
Modern platforms offer highly customizable dashboards that can be tailored to the needs of different stakeholders, from on call engineers to executive leadership. You can create high level "red/green" views for management while providing deep, filterable technical views for the DevOps team. These dashboards often include predictive analytics that use machine learning to forecast when an SLO might be breached based on current trends. By integrating your cluster states and infrastructure data into these views, you can maintain a constant pulse on the reliability of your entire ecosystem. This visibility is what enables teams to move fast without breaking the promises they have made to their customers.
Top DevOps SLA Monitoring Tools Comparison
| Tool Name | Best For | SLA Feature | Deployment |
|---|---|---|---|
| Datadog | Full-Stack Observability | Built-in SLO widgets | SaaS |
| Dynatrace | Enterprise AIOps | Davis AI for RCA | SaaS / Managed |
| Prometheus | Kubernetes Metrics | PromQL for SLIs | Self-hosted |
| New Relic | Application Performance | SLM (Service Level Management) | SaaS |
| UptimeRobot | Simple Availability | Public status pages | SaaS |
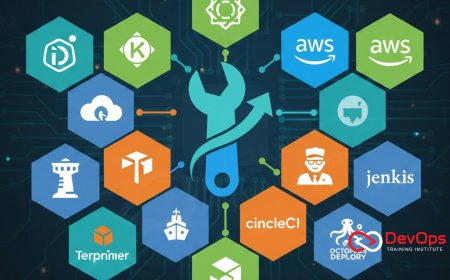
Open Source Solutions for Custom SLA Needs
For organizations that require full control over their data and monitoring logic, open source tools provide an unmatched level of flexibility. Prometheus has become the standard for collecting time series metrics in containerized environments, allowing engineers to define highly specific SLIs using the PromQL query language. When paired with Grafana, it becomes a powerful visualization engine capable of displaying complex SLA data across thousands of pods and services. This combination is particularly favored by teams that have already adopted GitOps to manage their monitoring configurations as code alongside their infrastructure.
Other open source projects like Icinga and Zabbix offer traditional infrastructure monitoring with modern extensions for cloud services. These tools are often used in hybrid environments where a mix of legacy on premises servers and new cloud instances must be monitored under a single SLA framework. By building your own monitoring stack, you avoid the "black box" nature of some SaaS providers and can tune your alerting thresholds to perfectly match your specific architecture patterns. This level of customization is vital for industries with unique performance requirements or those that must comply with strict data residency regulations that forbid sending telemetry to external third party vendors.
AIOps and Automated Root Cause Analysis
As production environments grow in complexity, the volume of alerts can quickly become overwhelming, leading to alert fatigue and missed SLA violations. This is where AIOps—Artificial Intelligence for IT Operations—comes into play. Tools like Dynatrace and BigPanda use machine learning to correlate thousands of disparate signals and automatically identify the root cause of an incident. Instead of getting fifty alerts about different failing services, the team receives one intelligent notification that points directly to the underlying issue, such as a misconfigured admission controller or a hardware failure in a specific cloud region.
Automated root cause analysis significantly reduces the Mean Time to Repair, which is the most critical metric for maintaining a high SLA. Some advanced tools can even trigger automated remediation scripts—such as rolling back a deployment or scaling a cluster—before a human engineer even logs in. This "self healing" capability is the ultimate goal of modern DevOps and SRE teams. By integrating these AI augmented devops capabilities into your production environment, you ensure that your systems are not just monitored but actively defended against the technical failures that threaten your service commitments and user satisfaction.
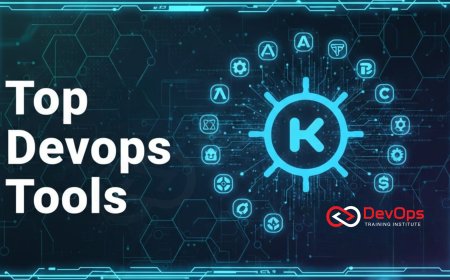
Essential SLA Monitoring Tools for 2026
- Datadog: A comprehensive observability platform with dedicated SLO and error budget tracking features.
- Prometheus: The open source leader for metric collection, essential for K8s native SLA monitoring.
- Grafana: The go to visualization tool that integrates with almost any data source to create SLA dashboards.
- Dynatrace: Leverages its "Davis" AI engine to provide automated root cause analysis and SLA reporting.
- New Relic: Features a robust Service Level Management module to track SLIs and SLOs across the full stack.
- AppDynamics: Focuses on the business impact of technical issues, mapping SLAs to revenue and user experience.
- UptimeRobot: A lightweight and cost effective tool for monitoring website and API availability from global locations.
- PagerDuty: While primarily for on call management, its analytics provide deep insights into incident trends and SLA impact.
- Site24x7: Provides an all in one monitoring solution covering servers, networks, and real user experiences.
- Checkmk: An extremely fast and scalable open source monitoring tool perfect for large, complex infrastructures.
- Honeycomb: Specializes in observability for high cardinality data, helping you find "needle in a haystack" SLA issues.
- Splunk Observability: Offers real time streaming analytics and full fidelity tracing to maintain high availability services.
Choosing the right tool depends on your team's size, budget, and existing technical stack. Start by identifying the most critical promises you make to your users and select the tool that provides the best visibility into those specific areas. Whether you need the simplicity of UptimeRobot or the AI power of Dynatrace, the goal is to create a continuous feedback loop between production performance and development priorities. Using the right containerd runtime and ensuring your continuous verification processes are robust will further solidify your production stability. Modern SLA monitoring is not just about catching failures; it is about building the confidence to innovate and scale at the speed of business.
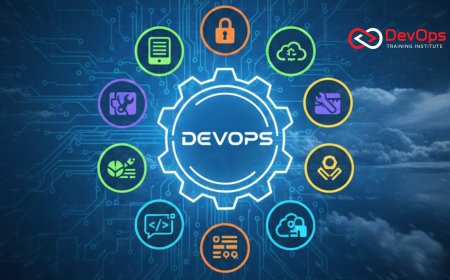
Conclusion: Monitoring as a Competitive Advantage
In conclusion, DevOps SLA monitoring is a fundamental pillar of modern production operations. By moving beyond simple uptime checks to a sophisticated strategy involving SLOs, error budgets, and AIOps, you can ensure that your organization consistently meets its service promises. These twelve tools provide the visibility and automation needed to manage the inherent complexity of cloud native systems. When you prioritize observability, you not only reduce downtime but also empower your development teams to move faster with the confidence that the platform will protect the user experience at all times.
As technology continues to evolve, the integration of ChatOps techniques and AI will make SLA monitoring even more intuitive and powerful. The key is to treat your monitoring configuration with the same care and rigor as your application code, utilizing GitOps for versioning and reproducibility. By investing in a robust SLA monitoring stack today, you are transforming a potential liability into a significant competitive advantage. A reliable service is a trustworthy service, and in the digital economy of twenty twenty six, trust is the most valuable currency your engineering team can produce. Stay vigilant, monitor everything, and keep your service promises to build a lasting and successful digital business.
Frequently Asked Questions
What is the difference between an SLA and an SLO?
An SLA is the legal agreement with the customer, while an SLO is the internal technical target used to meet that agreement.
Why is error budget tracking important for DevOps?
Error budgets provide a quantitative way to balance the need for new features with the requirement for system stability and reliability.
Can synthetic monitoring replace real user monitoring?
No, they are complementary; synthetics provide consistent baseline tests, while RUM shows the actual experience of your real users in production.
How does AIOps help in maintaining an SLA?
AIOps uses machine learning to automatically find the root cause of issues, significantly reducing the time it takes to repair failing services.
What is an SLI in the context of production monitoring?
An SLI is a Service Level Indicator, a specific metric like latency or error rate that is used to measure an SLO.
Do I need a dedicated team to manage SLA monitoring?
While a dedicated SRE team is helpful, modern automated tools allow most DevOps teams to manage their own SLA monitoring effectively.
How does a sidecar pattern assist in monitoring?
A sidecar can collect and export telemetry data from a service without requiring any changes to the application's core source code.
What is the benefit of a public status page?
Public status pages build trust by providing transparent, real time updates to your customers during system outages or maintenance periods.
Can I monitor SLAs for third party API dependencies?
Yes, many tools allow you to set up checks for external APIs to ensure your providers are also meeting their service commitments.
How often should I review my SLO targets?
SLO targets should be reviewed at least quarterly to ensure they still align with business goals and user expectations as systems evolve.
What role does logging play in SLA monitoring?
Logs provide the detailed context needed to troubleshoot the "why" behind a performance drop or an availability issue captured by metrics.
Is it possible to monitor SLAs in a multi cloud environment?
Yes, most modern SaaS monitoring tools provide a unified view across AWS, Azure, and Google Cloud for consistent SLA tracking everywhere.
What is alert fatigue and how do I avoid it?
Alert fatigue is when teams become overwhelmed by too many notifications; you avoid it by setting intelligent thresholds and using alert correlation.
Should I include database performance in my service SLA?
Yes, as database latency often directly impacts the user's response time, it is a critical indicator of overall service health and performance.
How can I automate my SLA reports for stakeholders?
Most enterprise monitoring tools allow you to schedule automated email or PDF reports that summarize your SLA performance over a specific period.
What's Your Reaction?
 Like
0
Like
0
 Dislike
0
Dislike
0
 Love
0
Love
0
 Funny
0
Funny
0
 Angry
0
Angry
0
 Sad
0
Sad
0
 Wow
0
Wow
0

![100+ Azure DevOps Interview Questions and Answers [Updated 2025]](https://www.devopstraininginstitute.com/blog/uploads/images/202509/image_140x98_68c40aa9a3834.jpg)


![Future Scope of DevOps Careers in Pune [Updated 2025]](https://www.devopstraininginstitute.com/blog/uploads/images/202510/image_140x98_68e3a84652312.jpg)


