


![Kong Interview Preparation Guide [2025]](https://www.devopstraininginstitute.com/blog/uploads/images/202509/image_430x256_68dbb95326997.jpg)


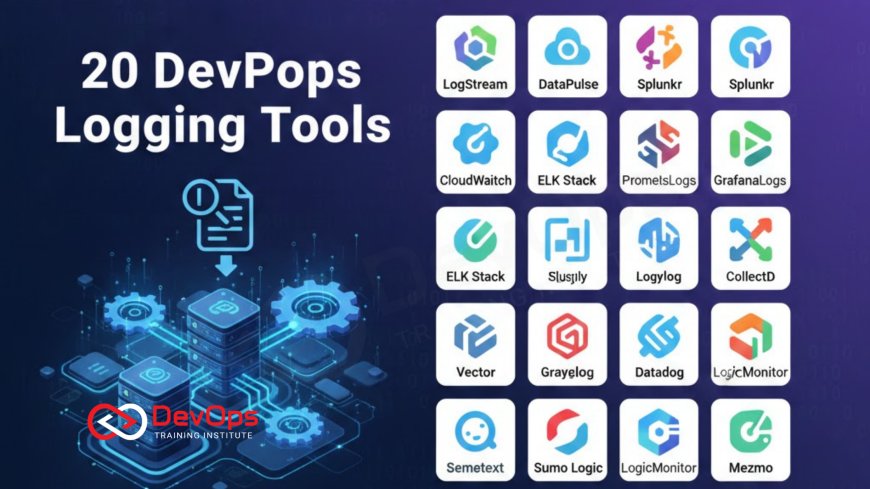
20 DevOps Logging Tools Compared Feature-wise
In this ultimate guide, we compare twenty of the most powerful DevOps logging tools for twenty twenty six, providing a deep feature-wise analysis to help your team choose the right solution. From industry giants like Splunk and Datadog to cost-efficient open-source alternatives like Grafana Loki and OpenObserve, we explore the strengths and weaknesses of each platform. Learn about essential features such as AI-driven anomaly detection, full-text search capabilities, and seamless Kubernetes integration. Whether you are managing complex microservices or securing enterprise infrastructure, this comprehensive breakdown offers the technical insights needed to optimize your observability stack and reduce troubleshooting time in today's high-scale digital environments.
Introduction to Modern DevOps Logging Tools
Logging has evolved from simple text files on a local server into a complex, distributed telemetry system that powers the heart of modern observability. In twenty twenty six, DevOps teams are no longer just collecting data; they are seeking actionable insights that can prevent outages before they happen. The right logging tool act as a centralized brain for your infrastructure, aggregating millions of events from containers, cloud services, and applications into a single, searchable interface. This visibility is essential for maintaining the high availability and performance that today's global users expect from every digital service.
Choosing the right tool in such a crowded market can be overwhelming, especially with the rise of specialized solutions for security, cost-optimization, and artificial intelligence. Many organizations are moving away from traditional, expensive models toward more flexible architectures that separate storage from compute. This transition allows teams to "log everything" without breaking the budget, enabling deeper forensic analysis and more accurate continuous verification. As we compare these twenty leading tools, we will focus on how each one solves the specific challenges of scale, complexity, and cost in the current DevOps landscape.
The Shift Toward AI-Driven Log Analytics
One of the most significant trends for twenty twenty six is the integration of machine learning and AIOps into standard logging platforms. Tools like Dynatrace and Splunk are leading the way by using AI augmented devops to automatically detect patterns and anomalies that a human engineer might miss. Instead of manually writing complex regex queries, developers can now rely on automated root-cause analysis to pinpoint the exact line of code or configuration change that caused a system failure. This drastically reduces the Mean Time to Recovery (MTTR) and allows engineering teams to focus on innovation rather than fire-fighting.
These advanced features are particularly valuable in microservices environments where a single user request can pass through dozens of different services. AI-driven tools can correlate logs with traces and metrics, providing a holistic view of the system's health. By understanding the normal baseline of your cluster states, these tools can alert you to subtle degradations in performance long before they escalate into full-blown incidents. This proactive approach is a cornerstone of a mature DevOps culture, where data is used not just for post-mortems, but for real-time guidance and operational excellence.
Open Source vs. Commercial Logging Solutions
The debate between open-source and commercial logging solutions has shifted toward a "best-of-both-worlds" approach. Open-source stacks like ELK (Elasticsearch, Logstash, Kibana) or the LGTM stack (Loki, Grafana, Tempo, Mimir) offer unparalleled flexibility and community support. They are ideal for teams that want full control over their data and infrastructure. However, managing these stacks at scale requires significant expertise and operational overhead. For many organizations, the cost of the engineers required to maintain a massive Elasticsearch cluster can exceed the licensing fees of a managed SaaS provider.
Commercial providers like Datadog and New Relic have responded by offering more transparent, usage-based pricing and "one-click" integrations that provide immediate value. These platforms are designed to reduce the "toil" of setting up observability, allowing teams to start seeing data in minutes. Many of these vendors also provide specialized ChatOps techniques for incident response, integrating directly with Slack or Microsoft Teams. Ultimately, the choice depends on your team's size, budget, and internal technical capacity, but the gap in functionality between the two models continues to narrow as open-source projects adopt more enterprise-grade features.
Key Features for Scalable Log Management
When evaluating a logging tool for twenty twenty six, several key features should be at the top of your list. First is the ability to handle high-cardinality data, which is common in containerized environments where pod names and IP addresses change constantly. Second is the search performance; you need a tool that can query billions of lines of logs in seconds during a critical outage. Tools like OpenObserve and ClickStack are gaining popularity because they use columnar storage and object storage (like S3) to provide high performance at a fraction of the cost of traditional indexing methods.
Another essential feature is the integration with security workflows, often referred to as DevSecOps. A modern logging tool should not only help with troubleshooting but also provide threat detection and compliance auditing capabilities. Using admission controllers and log-based security alerts can help identify malicious activity within your clusters. Finally, the tool should support OpenTelemetry standards, ensuring that your data is portable and that you are not locked into a single vendor's proprietary agent. This flexibility is vital for any long-term cultural change toward open standards and interoperability.
Comparison Table: Top 20 Logging Tools
| Tool Name | Best For | Key Strength | Deployment Type |
|---|---|---|---|
| Elastic Stack | Advanced Search | Powerful full-text search | SaaS or On-Prem |
| Splunk | Large Enterprises | Enterprise-grade SIEM/ML | SaaS or On-Prem |
| Datadog | Full Observability | Deep integrations (600+) | SaaS |
| Grafana Loki | Cost Efficiency | Metadata-only indexing | SaaS or On-Prem |
| OpenObserve | Cloud-Native Teams | SQL querying on S3 | SaaS or On-Prem |
| New Relic | Engineering Teams | Generous free tier (100GB) | SaaS |
| Graylog | Security/Compliance | Forensic search & SIEM | Self-Hosted |
| Sumo Logic | Multi-Cloud | Real-time intelligence | SaaS |
| Dynatrace | AIOps Automation | Davis AI root-cause analysis | SaaS |
| Logz.io | Managed Open Source | Cloud-hosted ELK & AI | SaaS |
| Better Stack | Incident Velocity | Fast query (1B lines/sec) | SaaS |
| SigNoz | Unified Telemetry | OpenTelemetry native | Self-Hosted |
| Chronosphere | High Cardinality | Scale-ready metrics/logs | SaaS |
| Honeycomb | Observability Science | Analyzing deep event data | SaaS |
| Logstash | Data Pipeline | 200+ input/output plugins | Tool |
| Fluent Bit | Edge/Sidecar | Tiny footprint (4MB binary) | Tool |
| Uptrace | Microservices | Deep trace-log correlation | SaaS or On-Prem |
| VictoriaMetrics | Metric-heavy logs | Extreme storage efficiency | Self-Hosted |
| Syslog-ng | Log Routing | High-speed secure transport | Tool |
| ClickStack | Massive Scale | SQL analytics on ClickHouse | SaaS or On-Prem |
Optimizing Logging Costs in Kubernetes
In a Kubernetes environment, the sheer volume of logs generated by transient pods and sidecars can quickly become a financial burden. To optimize costs, many teams are adopting a tiered storage strategy where logs are moved from expensive high-performance disks to cheaper object storage as they age. Tools like Grafana Loki and OpenObserve are specifically designed for this model, allowing you to query logs directly from S3 or GCS without needing to re-index them. This "index-free" or "metadata-only" approach can reduce storage costs by up to ninety percent, making long-term retention a feasible reality for modern enterprises.
Another best practice is to "log at the edge" by using lightweight forwarders like Fluent Bit to filter and enrich logs before they even leave the node. This reduces the network bandwidth and the amount of data that needs to be processed by the central ingestion server. You can use containerd compatible logging drivers to ensure that your log collection is as efficient as possible. By reducing the noise and focusing on high-value telemetry, you can maintain deep visibility into your application's behavior while keeping your cloud bill under control. It is a critical part of choosing cloud architecture patterns that scale effectively for the future.
Integrating Security and Compliance in Logging
Logging is not just for developers; it is a fundamental requirement for security and compliance teams. In twenty twenty six, logging tools are expected to double as SIEM (Security Information and Event Management) platforms, providing real-time threat hunting and audit trails. Graylog and Splunk are popular choices in this area because they offer built-in threat intelligence feeds and automated compliance reports for regulations like GDPR and SOC2. By centralizing security logs alongside operational logs, teams can correlate system errors with potential security breaches, leading to a much more robust incident handling process.
To prevent sensitive information from being logged in the first place, many teams are using secret scanning tools to detect and redact API keys or personal data from the log stream. This proactive approach ensures that your logging infrastructure does not become a security vulnerability itself. Furthermore, using GitOps to manage your logging configurations ensures that your retention and anonymization policies are versioned and auditable. This integration of security into the standard logging workflow is a hallmark of the DevSecOps movement, ensuring that compliance is maintained without slowing down the development cycle.
Logging Best Practices for Twenty Twenty-Six
- Structured Logging: Always use JSON or another structured format for your logs to make them easier to parse and query automatically by any tool.
- OpenTelemetry Adoption: Use the OTel collector to ensure that your logging pipeline is standardized and not tied to a specific vendor's proprietary agent.
- Correlate Logs and Traces: Ensure your logging tool can link logs to distributed traces using a unique Trace ID for faster debugging.
- Automate Anomaly Detection: Leverage continuous verification to identify unusual patterns in your logs that indicate potential system failures.
- Implement Retention Policies: Define clear policies for how long logs should be kept to balance operational needs with storage costs and compliance.
- Use Sampling Wisely: For high-volume services, consider sampling your logs to reduce data ingestion costs while still maintaining enough data for trend analysis.
- Integrate with Release Strategies: Tag your logs with the application version to see how different release strategies affect system errors and performance.
By following these best practices, you create a logging environment that is both a powerful diagnostic tool and a strategic asset for your business. It is about moving beyond "finding the error" to "understanding the system." As you build out your observability stack, remember that the most expensive tool is not always the best one. The best tool is the one that fits into your team's workflow and provides the most clarity during a crisis. Continuous refinement of your logging strategy based on real-world incident data will help you stay ahead of the curve and maintain a world-class DevOps operation for years to come.
Conclusion: Choosing Your Logging Path
In conclusion, the logging landscape in twenty twenty six is defined by a focus on AIOps, cost-efficiency, and unified observability. Whether you choose a high-end enterprise solution like Splunk or a modern, cloud-native alternative like OpenObserve, the goal remains the same: to turn vast amounts of raw data into clear, actionable insights. By separating storage from compute and embracing open standards like OpenTelemetry, you can build a resilient logging pipeline that grows with your organization. The transition to these advanced tools often requires a shift in mindset, prioritizing automated analysis over manual log searching.
As you move forward, consider how AI augmented devops can further streamline your log management by predicting performance bottlenecks. Staying updated with emerging trends will ensure your technical foundation remains solid. Ultimately, your logging tool should empower your developers to ship software with confidence and your operators to resolve issues with precision. Start by evaluating your current costs and search speed, and then choose a tool that bridges the gap between where you are and where you need to be in the fast-paced digital world of today.
Frequently Asked Questions
What is the difference between log management and log analysis?
Log management focuses on collecting and storing data, while log analysis involves searching and interpreting that data to find specific insights and errors.
Why is Grafana Loki considered more cost-effective than Elasticsearch?
Loki indexes only metadata rather than the full log content, which significantly reduces storage requirements and the associated costs for high-volume logs.
What role does AI play in modern logging tools?
AI helps by automatically detecting anomalies, clustering similar errors, and performing root-cause analysis to speed up the incident resolution process significantly.
How does OpenTelemetry impact my logging strategy?
OpenTelemetry provides a standardized way to collect and export logs, ensuring your pipeline is not locked into a single vendor's proprietary technology.
Can I use a single tool for metrics, logs, and traces?
Yes, unified observability platforms like Datadog, New Relic, and SigNoz allow you to view all three telemetry types in a single interface.
What is high cardinality and why is it a challenge?
High cardinality refers to data with many unique values (like user IDs), which can slow down traditional databases and increase indexing costs dramatically.
Is it possible to query logs directly from S3?
Yes, modern tools like OpenObserve and ClickStack allow you to run SQL-like queries on logs stored in cheap object storage like Amazon S3.
What are the benefits of structured logging?
Structured logging (like JSON) makes it much easier for automated tools to parse, filter, and aggregate log data without complex custom regex patterns.
How long should I keep my application logs?
Retention depends on your compliance needs and budget; most teams keep operational logs for 30 days and audit logs for much longer periods.
What is the ELK stack and is it still relevant?
The ELK stack (Elasticsearch, Logstash, Kibana) remains highly relevant for teams that need powerful full-text search and a fully customizable open-source platform.
Does Splunk offer a free version for small teams?
Splunk offers a limited free trial and a "Free" version with reduced features and ingestion limits, but it is primarily an enterprise-focused paid product.
How can I redact sensitive data from my logs?
You can use log forwarders like Fluent Bit or specialized security tools to identify and mask personal information before the logs are ingested.
What is trace-log correlation?
It is the process of linking log messages to specific distributed traces using IDs, allowing you to see the exact logs for a single request.
Should I host my own logging infrastructure?
Self-hosting offers control and can be cheaper at massive scale, but it requires significant engineering effort compared to using a managed SaaS platform.
What is the first step in optimizing my logging bill?
The first step is to identify and filter out high-volume, low-value logs at the edge before they are sent to your expensive ingestion server.
What's Your Reaction?
 Like
0
Like
0
 Dislike
0
Dislike
0
 Love
0
Love
0
 Funny
0
Funny
0
 Angry
0
Angry
0
 Sad
0
Sad
0
 Wow
0
Wow
0
![100+ Azure DevOps Interview Questions and Answers [Updated 2025]](https://www.devopstraininginstitute.com/blog/uploads/images/202509/image_140x98_68c40aa9a3834.jpg)


![Future Scope of DevOps Careers in Pune [Updated 2025]](https://www.devopstraininginstitute.com/blog/uploads/images/202510/image_140x98_68e3a84652312.jpg)


