


![Kong Interview Preparation Guide [2025]](https://www.devopstraininginstitute.com/blog/uploads/images/202509/image_430x256_68dbb95326997.jpg)


Why Is Observability Recommended Before Scaling Microservices?
Observability is a critical prerequisite for scaling microservices because it provides the deep, actionable insights needed to manage a complex, distributed system. Unlike traditional monitoring, observability allows teams to understand the system's internal state to debug unknown issues and predict failures. By using a combination of logs, metrics, and traces, organizations can confidently scale their microservices architecture, reduce operational toil, and ensure system reliability. This approach fosters a blameless culture, enabling engineers to solve problems faster and move beyond reactive firefighting. Implementing observability from the beginning is a strategic investment that is essential for a resilient and efficient cloud-native environment.
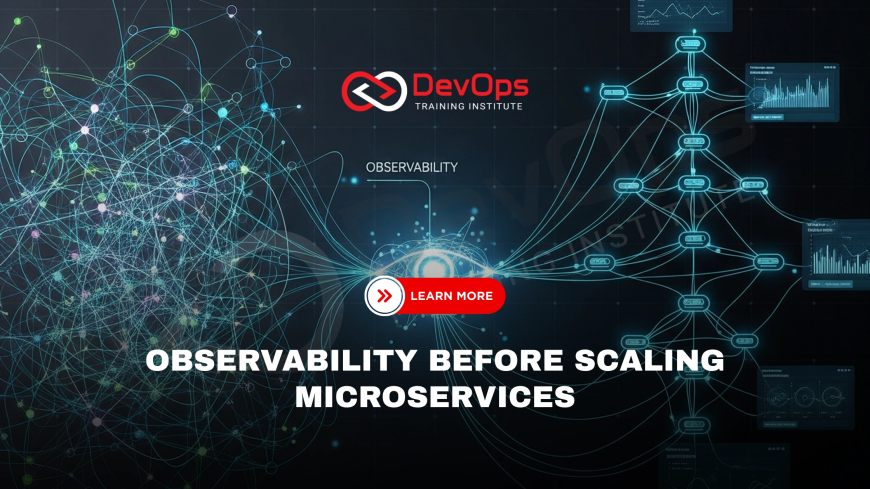
Table of Contents
- The Challenges of Scaling a Microservices Architecture
- What Is the Difference Between Monitoring and Observability?
- How Do the Three Pillars of Observability Help in a Distributed System?
- When Should You Implement Observability in Your Microservices Lifecycle?
- Monitoring vs. Observability: A Critical Comparison
- Observability for Proactive Problem-Solving
- Observability and the Impact on Team Culture and Efficiency
- Implementing a Robust Observability Strategy
- Conclusion
- Frequently Asked Questions
In the world of modern software development, microservices have become the de facto standard for building scalable, resilient, and agile applications. By breaking down a monolithic application into a collection of small, independently deployable services, organizations can accelerate development and innovate faster. However, this architectural choice comes with a new set of complexities. A distributed system, with its many moving parts and interconnected dependencies, is inherently difficult to understand and troubleshoot. A problem in one service can have a cascading effect on many others, creating a chain reaction that is nearly impossible to follow without the right tools. When you begin to scale such a system—adding more services, more instances, and more teams—the complexity grows exponentially. This is where observability becomes not just a nice-to-have, but a foundational requirement. Observability is the ability to understand the internal state of a system by examining the data it outputs. Without this deep, real-time insight, scaling a microservices architecture is like flying a plane blind, with no dashboard, no radar, and no way of knowing if you are heading for a crash. This article will explore the critical reasons why observability is an essential first step before you even think about scaling your microservices.
The Challenges of Scaling a Microservices Architecture
Scaling a microservices architecture is a fundamentally different challenge than scaling a monolith. In a monolithic application, you typically scale vertically or horizontally by adding more instances of the same application. The interactions within the application are contained, making them relatively easy to monitor. In a microservices architecture, however, every interaction between services is a network call, introducing new points of failure and latency. As you scale, the number of services and their dependencies can grow into a tangled web, a phenomenon often referred to as a "distributed monolith." When an issue arises, it's no longer enough to look at a single server's logs. A single user request might span dozens of services, each with its own state, logs, and metrics. Troubleshooting a performance bottleneck or a failed transaction becomes a complex and time-consuming detective story. Without a clear, unified view of the entire system, teams are left to manually sift through disparate data from various services to piece together the sequence of events. This reactive, "firefighting" approach is unsustainable and prevents teams from focusing on innovation. The lack of a shared understanding of the system's behavior is the primary impediment to successful and predictable scaling.
What Is the Difference Between Monitoring and Observability?
While often used interchangeably, monitoring and observability are two distinct concepts. Understanding the difference is crucial for managing modern, complex systems.
Traditional Monitoring
Monitoring is a practice centered on known failures. It is about collecting a predefined set of metrics and logs to determine if a system is healthy. You set up dashboards and alerts for things you expect to go wrong. For example, you might monitor CPU usage, memory utilization, or the number of HTTP requests a service is receiving. When a metric crosses a certain threshold, an alert is triggered, and a human is notified to investigate. The problem with monitoring is that it's reactive and doesn't provide the context needed to understand why a problem is occurring. It can tell you that a service is failing, but not necessarily why, especially in a distributed system where the root cause might lie in another service entirely. It answers the question, "Is the system working?" .
Observability
Observability, on the other hand, is a system property. It's the ability to infer the internal state of a system by analyzing the data it produces. It's about having the tools and data to ask any question about the system, even for problems you didn't know could happen. Observability is proactive, focusing on understanding the "why" behind a system's behavior. By combining the three pillars—logs, metrics, and traces—teams can not only identify that a service is failing but also trace the entire request path, pinpoint the exact line of code that caused the failure, and see the context in which it happened. This empowers teams to go from a reactive, firefighting approach to a proactive, investigative one. It answers the question, "Why isn't the system working?" and is essential for troubleshooting unforeseen issues in a distributed architecture.
How Do the Three Pillars of Observability Help in a Distributed System?
A robust observability strategy is built on three core pillars: metrics, logs, and traces. Each pillar provides a different perspective on the system's behavior, and together, they provide a complete picture that is essential for managing a scalable microservices architecture.
1. Metrics
Metrics are numerical measurements of an application or service's behavior over time. They are the most common form of data collected and are best used for a high-level view of system health and performance. Examples include CPU utilization, memory usage, request latency, and error rates. Metrics are highly efficient to store and query, making them ideal for monitoring dashboards and alerting. They are your first line of defense, providing a quick way to spot anomalies and trends. For a distributed system, a key metric is the number of requests to a specific service, which can help you identify bottlenecks or services that are under unusual load. Metrics tell you "what" is happening.
2. Logs
Logs are timestamped records of events that occur within a service. They are the most detailed form of data and provide a rich narrative of what a service is doing. When a problem occurs, logs can be invaluable for finding the exact sequence of events that led to the issue. In a microservices architecture, centralized log management is critical. Without a unified system, logs are scattered across dozens or hundreds of services, making it nearly impossible to correlate events. A centralized logging system allows you to search and analyze logs from all services in one place, providing a much clearer picture of what went wrong. Logs tell you "where" something happened.
3. Traces
Traces (or distributed traces) are the most important pillar for microservices. A trace follows a single user request as it traverses multiple services. It provides a complete, end-to-end view of the request's journey, showing you the latency at each step, the dependencies between services, and where a failure occurred. Without traces, it is a guessing game to figure out which service is causing a performance bottleneck or an error. By analyzing a trace, you can immediately pinpoint the source of a problem, even if it is in a service you didn't expect. Traces tie everything together, answering the critical question of "why" something is happening in a distributed system. .
When Should You Implement Observability in Your Microservices Lifecycle?
The best time to implement an observability strategy is before you begin to scale your microservices architecture, ideally as part of your initial architectural design. Treating observability as an afterthought—something you'll get to "later"—is a common mistake that leads to significant pain down the road. It is far more difficult and costly to retrofit a mature observability practice into a large, complex system than it is to build it in from the beginning.
- Start at the Architectural Level: Make observability a core design principle for every service you build. This means instrumenting your code to emit the necessary logs, metrics, and traces from the very beginning.
- Choose the Right Tools: Select a unified observability platform that can collect, correlate, and visualize data from all three pillars. A single platform reduces the complexity of managing multiple tools and provides a cohesive view of your system.
- Create a Culture of Observability: Encourage your developers to use the observability tools to understand the performance of their code. Make it part of the development lifecycle, so that every time a new service is deployed, it automatically contributes to the overall observable state of the system.
- Define Clear Standards: Establish consistent naming conventions for metrics, log formats, and tracing IDs across all teams and services. This standardization is critical for making the data searchable and understandable at scale.
Monitoring vs. Observability: A Critical Comparison
While traditional monitoring remains useful for specific, known checks, observability provides a far more powerful and comprehensive solution for today's complex, dynamic systems. The table below illustrates the key differences in their approach and capabilities.
| Aspect | Traditional Monitoring | Observability |
|---|---|---|
| Scope | Focuses on known failures and predefined metrics. | Focuses on understanding the system's internal state. |
| Approach | Reactive: Alerts you when something you expect goes wrong. | Proactive/Investigative: Provides data to debug unknown issues. |
| Data Sources | Limited to a predefined set of metrics and logs. | Combines metrics, logs, and distributed traces. |
| Questions Answered | "Is the system up?" "Is the CPU usage too high?" | "Why is the system slow?" "What caused this error?" |
| Troubleshooting | Difficult; requires manual log correlation and guesswork. | Empowers engineers to easily find the root cause of issues. |
| Best For | Simple, predictable systems (e.g., a single server). | Complex, dynamic, distributed systems (e.g., microservices). |
Observability for Proactive Problem-Solving
Beyond simply reacting to failures, a robust observability practice allows teams to shift their focus to proactive problem-solving and optimization. By continuously analyzing the data from your system, you can identify performance bottlenecks and potential points of failure before they cause a production outage. For example, by analyzing distributed traces, you might notice that a specific service has an unusually high latency during a certain time of day. While this isn't an outage, it's a clear signal that a performance problem is emerging. Observability provides the data to investigate this issue, allowing you to optimize your code or infrastructure before the latency grows to an unacceptable level. This proactive approach prevents a minor issue from becoming a major one, which is invaluable for maintaining system reliability at scale. It transforms your operations team from being a group of "firefighters" to a team of "architects" who are continuously optimizing the system for better performance and resilience. Observability turns guesswork into data-driven decision-making, which is a key component of a mature and efficient engineering organization. It's about getting ahead of the curve and solving problems before your customers even notice them, which is a major competitive advantage in today's market.
Observability and the Impact on Team Culture and Efficiency
The adoption of an observability-first mindset has a profound impact on an organization's culture. In a traditional environment, troubleshooting is often a frustrating and blame-oriented process. When an outage occurs, teams may spend hours or even days sifting through disjointed information, often pointing fingers at different teams or services. This not only burns out engineers but also creates silos and destroys trust. Observability fundamentally changes this dynamic. By providing a unified, comprehensive view of the entire system, it enables a blameless postmortem culture. When an incident occurs, the focus shifts from "who made the mistake?" to "what can we learn from the system's behavior?". The rich data from logs, metrics, and traces provides a clear, objective picture of what happened, allowing teams to quickly identify the root cause and implement a fix without the stress of assigning blame. This leads to a more collaborative and efficient team environment. Engineers are empowered to solve problems and learn from failures, which in turn leads to a more resilient and reliable system. A culture of observability is a culture of learning and continuous improvement, where every incident is seen as an opportunity to make the system better, which is the ultimate goal of a mature DevOps practice.
Implementing a Robust Observability Strategy
Implementing a robust observability strategy for a microservices architecture is a multi-step process. Here are the key components to consider.
1. Instrument Your Services
This is the most critical step. Every service must be instrumented to emit the three pillars of observability: logs, metrics, and traces. Use open standards like OpenTelemetry to ensure your data is vendor-agnostic and easy to integrate with different tools. Instrumenting your code from the beginning is much easier than doing it later, and it provides a clear, unified approach across all your services.
2. Centralize Your Data
A scattered collection of data is useless. You need a centralized platform to collect, store, and analyze all of your observability data. A good platform will provide a unified dashboard, powerful search capabilities, and the ability to correlate logs, metrics, and traces from different services to provide a holistic view of the system. This ensures that when a problem arises, your team has all the necessary information in one place to quickly find the root cause.
3. Establish Standardized Practices
To ensure that the data is useful and actionable, you must establish standardized naming conventions, logging formats, and tracing standards across your organization. This makes it easy for engineers to move between teams and services, as they will be working with a consistent and predictable data format. Standardizing your practices is the key to making observability scalable as your organization and your microservices architecture grow.
By following these steps, you can create an observability practice that serves as the foundation for a scalable, resilient, and manageable microservices architecture. It is an investment that pays for itself many times over in the form of reduced downtime, faster troubleshooting, and a more productive engineering team. Without it, you are simply hoping for the best, and in a complex system, hope is not a strategy.
Conclusion
In a world of complex, distributed systems, observability is the essential prerequisite for successful and sustainable scaling. It moves organizations beyond the limitations of traditional monitoring, providing the deep, actionable insights needed to understand the "why" behind system behavior. By implementing a strategy built on the three pillars—metrics, logs, and traces—teams can proactively identify and solve problems, reduce the time spent on firefighting, and confidently manage their microservices architecture. Building observability in from the beginning is a strategic decision that enables a blameless, data-driven culture, which is crucial for fostering collaboration and innovation. Ultimately, observability is not just a set of tools; it is a fundamental shift in mindset that empowers engineers with the information they need to build and maintain resilient, high-performing systems. Without it, the promise of microservices—agility and scalability—remains an unreachable dream, lost in a sea of complexity and unknown failures.
Frequently Asked Questions
What is the "blameless postmortem" culture?
A blameless postmortem culture is an environment where teams analyze system incidents without assigning personal blame. The focus is on understanding the systemic and technical causes of a failure to learn from it and prevent similar incidents in the future. Observability provides the data needed for an objective, blameless analysis.
How does observability help with cost management?
Observability helps with cost management by providing visibility into resource usage. By analyzing metrics and traces, you can identify inefficient services or underutilized resources. This data-driven approach allows you to optimize your infrastructure and scale resources more efficiently, preventing unnecessary spending as your architecture grows.
What is "distributed tracing"?
Distributed tracing is the process of tracking a single request as it travels through a distributed system. It provides a visual representation of the entire request path, showing the latency and dependencies between different services. This is invaluable for troubleshooting performance bottlenecks and understanding the flow of a complex transaction.
Is observability the same as APM?
While a modern APM (Application Performance Management) tool provides observability, the two are not the same. APM is a class of software that provides observability and monitoring capabilities. Observability is a system property and a practice. You can achieve observability without a full APM suite, though many use APM tools to do so.
What are some common observability tools?
Common observability tools include open-source options like Prometheus (metrics), Grafana (visualization), and OpenTelemetry (instrumentation). Commercial platforms like Datadog, Dynatrace, and New Relic provide a unified solution for collecting, correlating, and analyzing logs, metrics, and traces in a single platform.
How does observability help with continuous delivery?
Observability accelerates continuous delivery by providing real-time feedback on new deployments. By observing the impact of a new release on your system's health, you can quickly identify and roll back a problematic deployment. This reduces the risk of new releases and empowers teams to deploy more frequently and with greater confidence.
How does observability differ from business intelligence?
Observability focuses on understanding the internal health and behavior of a system to optimize its performance and reliability. Business intelligence (BI) focuses on analyzing business data, such as sales figures and user engagement, to inform business decisions. While they both use data, their goals and contexts are entirely different.
Why is logging a challenge in microservices?
Logging is a challenge in microservices because logs are generated by dozens or hundreds of independent services. Without a centralized logging system, it's difficult to search, analyze, and correlate logs across different services to understand the full context of a problem, which is crucial for effective troubleshooting in a distributed system.
What is "instrumentation" in observability?
Instrumentation is the process of adding code to your application to generate observability data. This includes adding code to send metrics to a collector, emit logs with useful context, and create traces that follow a request across services. It is the crucial first step for making a system observable.
What is the role of OpenTelemetry?
OpenTelemetry is an open-source project that provides a standardized set of APIs, SDKs, and tools for instrumenting your code to generate and export telemetry data (logs, metrics, and traces). Its goal is to provide a vendor-agnostic way to collect observability data, preventing vendor lock-in and simplifying data collection.
Can you have observability without logs?
While you can gain some insights without logs, it is not recommended. Logs provide the most granular and detailed information about a system's behavior. Without them, you would have a hard time understanding the specific events that led to a problem, making debugging and root cause analysis much more difficult.
How does observability impact scalability?
Observability makes scalability possible by providing the insights needed to manage a complex, distributed system. It helps you identify performance bottlenecks, optimize resource usage, and troubleshoot issues quickly. Without observability, scaling a microservices architecture can lead to an unmanageable system where failures are frequent and difficult to diagnose.
What is a "service mesh" and how does it help with observability?
A service mesh is a dedicated infrastructure layer that handles service-to-service communication. It can automatically generate observability data, such as distributed traces and metrics, for all services without requiring developers to manually instrument their code. This simplifies the implementation of observability at scale.
How does observability reduce the time to detect and resolve incidents?
Observability reduces the time to detect and resolve incidents by providing a unified, contextual view of the system's state. By correlating logs, metrics, and traces in a single platform, engineers can quickly pinpoint the root cause of an issue and implement a fix, which drastically reduces the mean time to resolution (MTTR).
What is a "Golden Signal"?
The "Golden Signals" are a set of four key metrics defined by Google's SREs for monitoring user-facing systems: latency, traffic, errors, and saturation. They provide a high-level, actionable view of a system's health and are a crucial part of any observability strategy.
Can observability be a competitive advantage?
Yes, it can. A company with a mature observability practice can release new features faster, with greater confidence, and maintain higher levels of system reliability than its competitors. This agility and reliability lead to improved customer satisfaction and a stronger market position, which are significant competitive advantages.
How does observability help with incident management?
Observability is the foundation of effective incident management. By providing real-time data on the system's internal state, it enables teams to quickly detect, triage, and resolve incidents. The rich data also supports a blameless postmortem process, which is critical for learning and improving system resilience over time.
What is the difference between a white-box and black-box monitoring?
Black-box monitoring treats a system as a black box and measures its external behavior (e.g., API response time). White-box monitoring uses data from inside the system (e.g., CPU usage, internal metrics) to understand its behavior. Observability is a form of white-box monitoring that provides deep, comprehensive insights.
How do you sell observability to management?
You sell observability to management by focusing on its business benefits: reduced downtime, faster time-to-market, improved customer satisfaction, and increased engineering efficiency. Observability is not just a technical tool; it is a strategic investment that directly impacts the company's bottom line and competitive position.
What is a "service map" and how does it help?
A service map is a visual representation of all the services in a distributed system and their dependencies. It is built using data from distributed traces and provides a high-level view of how a request flows through the system. This is invaluable for understanding the architecture and troubleshooting complex, multi-service incidents.
What's Your Reaction?
 Like
0
Like
0
 Dislike
0
Dislike
0
 Love
0
Love
0
 Funny
0
Funny
0
 Angry
0
Angry
0
 Sad
0
Sad
0
 Wow
0
Wow
0


![100+ Azure DevOps Interview Questions and Answers [Updated 2025]](https://www.devopstraininginstitute.com/blog/uploads/images/202509/image_140x98_68c40aa9a3834.jpg)


![Future Scope of DevOps Careers in Pune [Updated 2025]](https://www.devopstraininginstitute.com/blog/uploads/images/202510/image_140x98_68e3a84652312.jpg)


